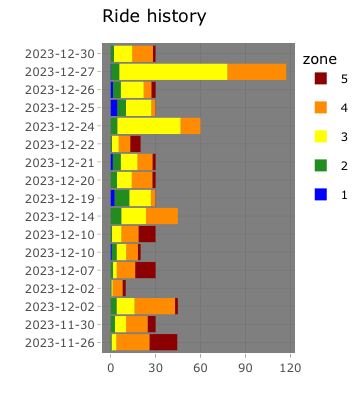
I did this two-hour power zone ride the other day – whoooo! – and now all the other rides in my recent history plot look like lil tiny guys.
- Huge revision of the backend method for stat calculation, making it more flexible and accurate
- Highlighting of masterwork items in display
- Proper forwarding of selected ability fragments to DIM for loadout building (this was harder than I thought it would be)
- really good workout
- helped make spritz cookies
- wrapped gifts
- fixed oauth flow of my shiny armorer app for Destiny 2
The last couple of weekends I’ve been slowly working on some improvements to Armorer, my Destiny 2 loadout finder build in Shiny.
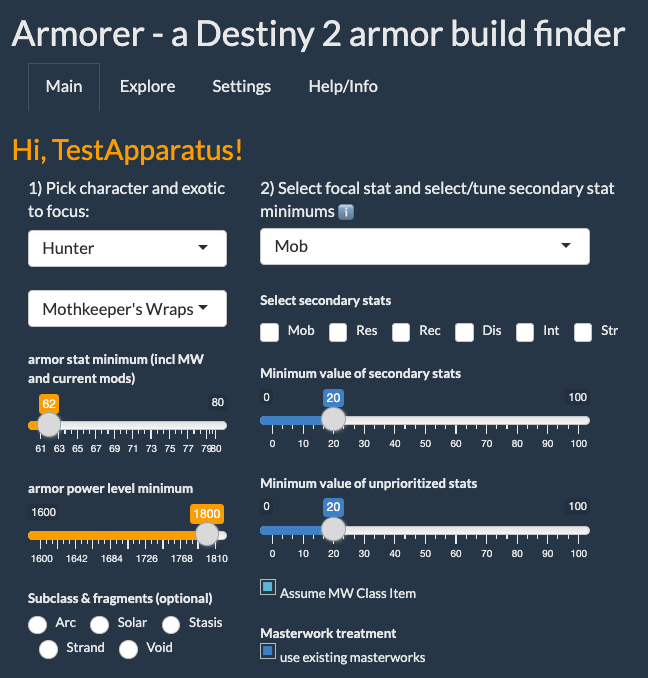
Notable enhancements for this release include:
There are some bugs to address and optimization to perform, of course. But, with these improvements, the tool is finally just about as functional as I have long wanted it to be! I think it’s really pretty good, and I’m pleased and proud to have made something sophisticated and useful. I hope some more Destiny 2 players will try it out and let me know how it works for you.
I had some really nice hours this weekend working on my Destiny 2 loadout finder project, Armorer. All my current work is on the backend, and will result eventually in a lot more flexibility in armor piece stat calculation, and – I hope – faster performance. This big Shiny application is complex enough that I can see the rest of the work to do right in front of me, and I know that completing all the revisions is still a pretty substantial piece of work!
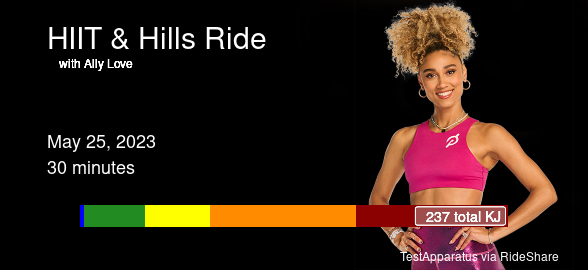
Vacation days are great! Today I improved RideShare, my Shiny app that makes shareable ride cards from my Peloton workouts. I had to update to accommodate the new images that the API sends, and I added a clickable history to build cards for any recent ride. I don’t like the styling of these new images quite as much – they’re not as powerful-looking cycling-specific images as the old feed provided – but I’m still really pleased with what I can build with it!
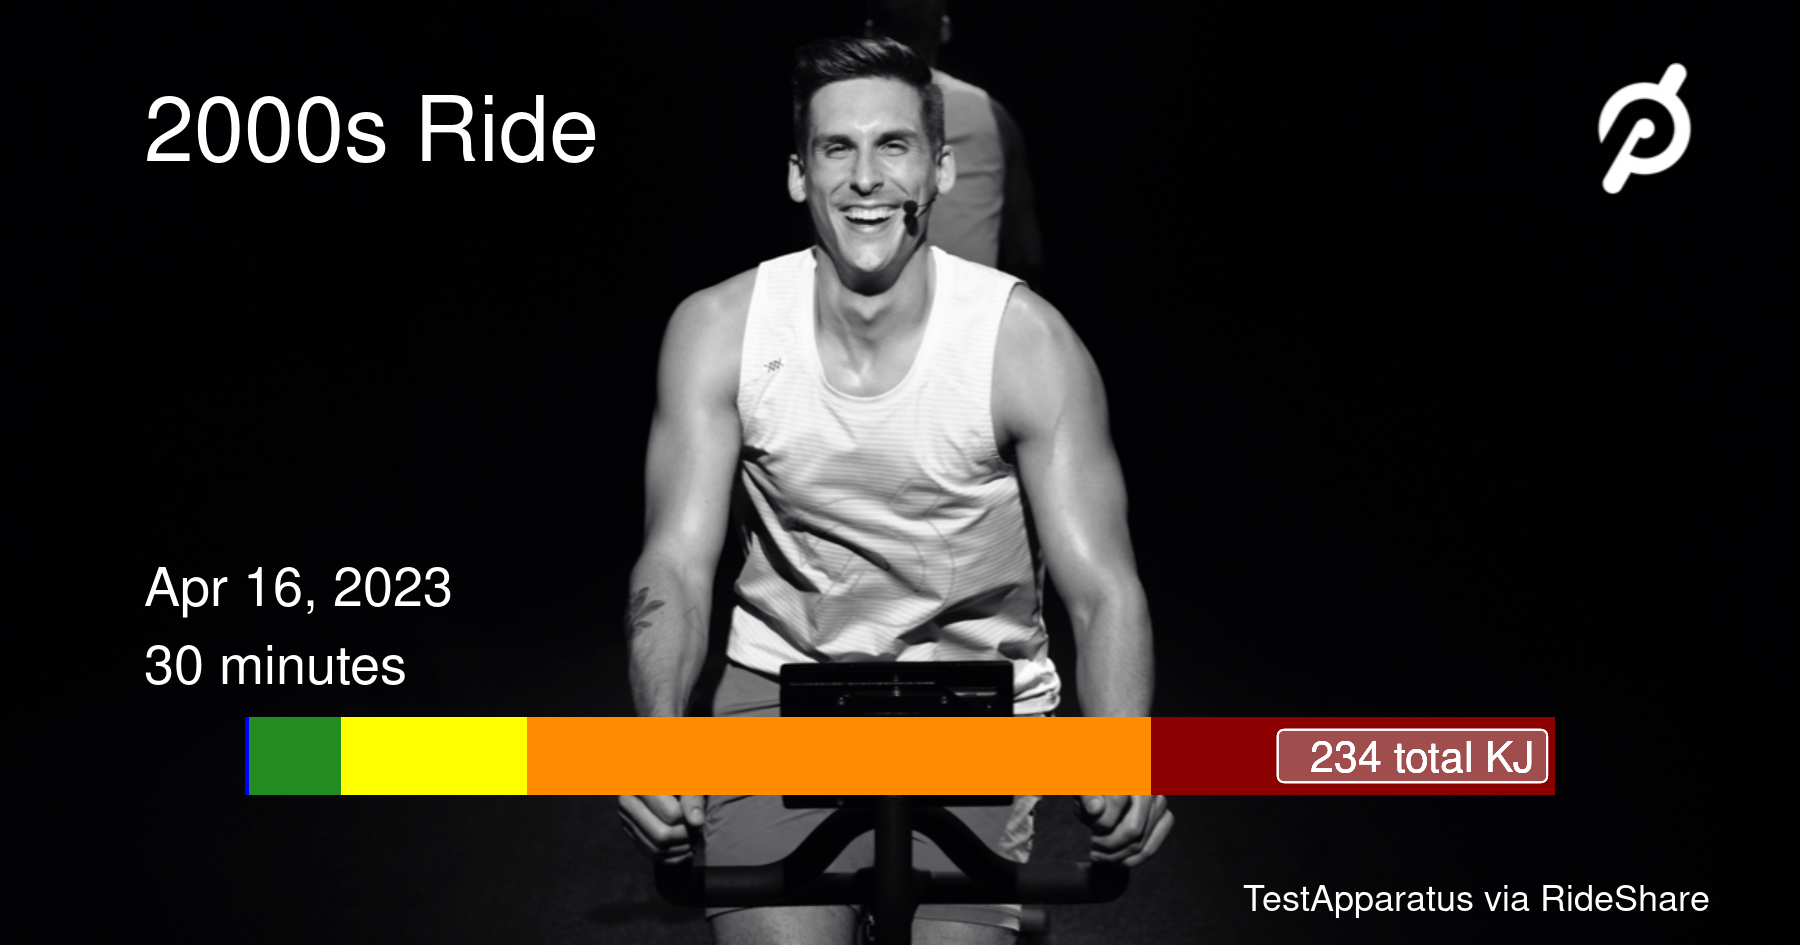
This morning’s ride was a good start to a busy Sunday. I also got to test out my custom little Shiny app for building nice little shareable images with the Peloton API!
The launch of the new Destiny 2 expansion, Nightfall, adds a new subclass – Strand – and restructures the mod system that affects player stats gained from armor. I’m happy to report that it only took me a couple of hours to revise my Shiny tool to find optimal armor loadouts using the new mods and subclass fragments! I had to hunt a little through some old code, and next time it should be a simple and easy update due to having fixed how I work with the manifest.
👍 Christmas Eve, so far:
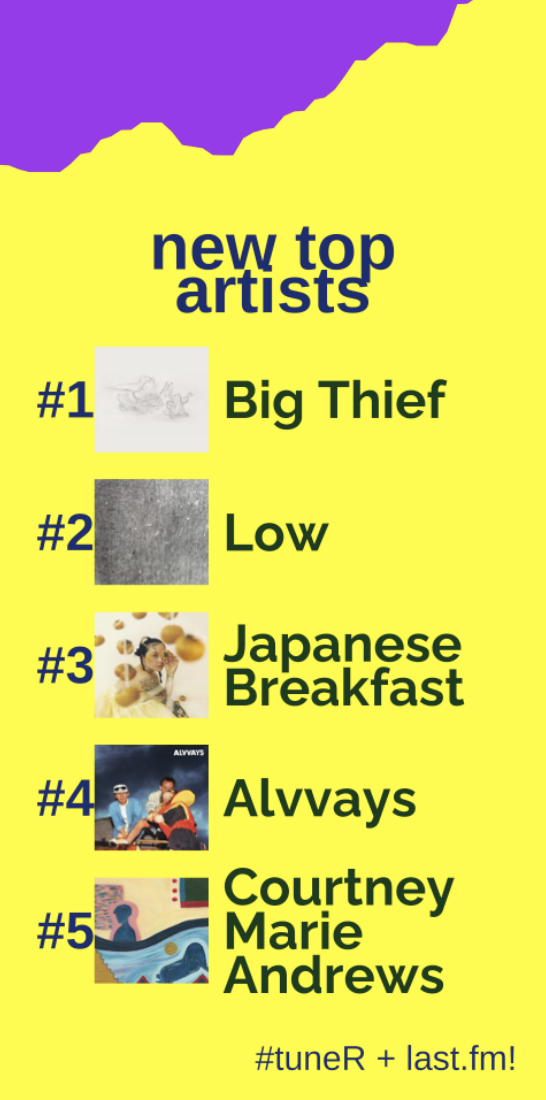
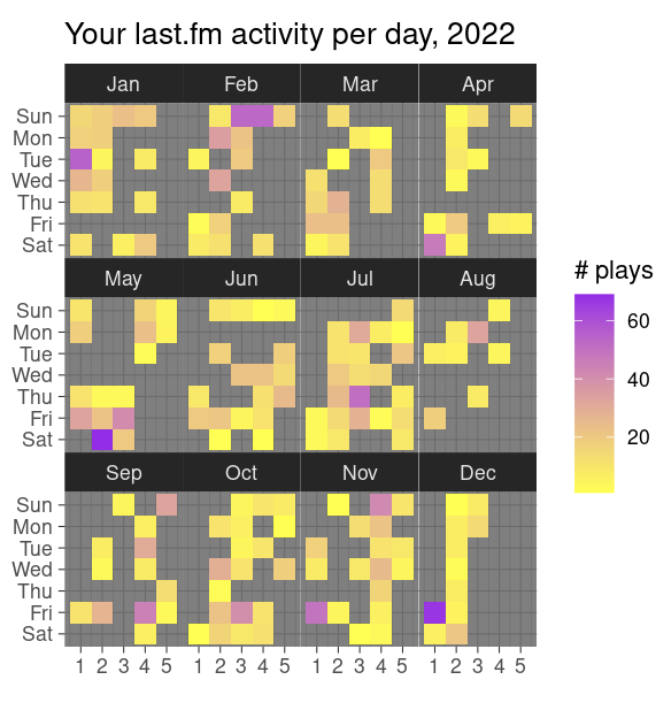
I dusted off the last.fm data visualizer that I started working on last year around this time. This year I built a couple of fun Spotify-wrapped-like visualizations; why should Spotify users have all the fun?
If you’re a last.fm user, you can try it, too! TuneR is a small Shiny app that you can provide your last.fm username and see your year in music, a comparison of this year to your all-time most-listened artists, and a fun heatmap of your listening activity.
Got nginx running on my MacBook today, as part of building some working-with-APIs-infrastructure for a small tutorial I want to write on working with oauth in Shiny. Good step!
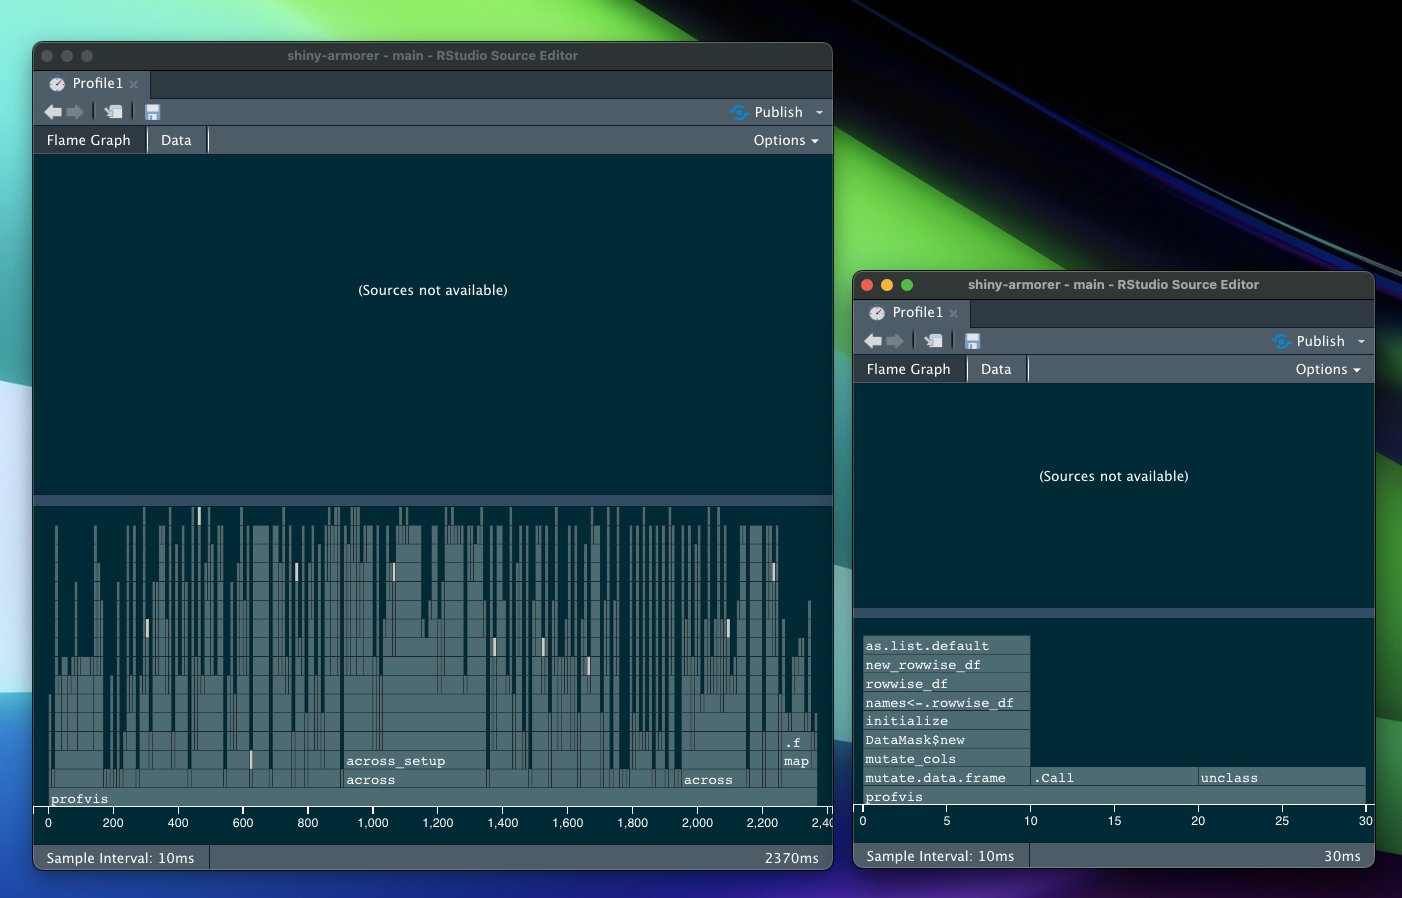
I used the RStudio tool profvis this weekend to find speed improvement opportunities in Armorer. I suspected that I could rewrite a big operation that calculates the maximum of many columns across several thousand rows. Holy smokes: Using matrixStats::rowMaxs cuts processing time by an amazing amount!