Keyboard Week!
What a great hobby week. A few days ago I built a keyboard with my kiddo, and yesterday I got started on a build for myself. We built the KBD67Lite from kbdfans. While I’ve had a couple of mechanical keyboards, these were the first that I’ve built up from parts – fortunately, the kbdlite comes as a nice kit which made for a gentle introduction to lubricating stabilizers. (Which, by the way, makes a tremendous difference.)
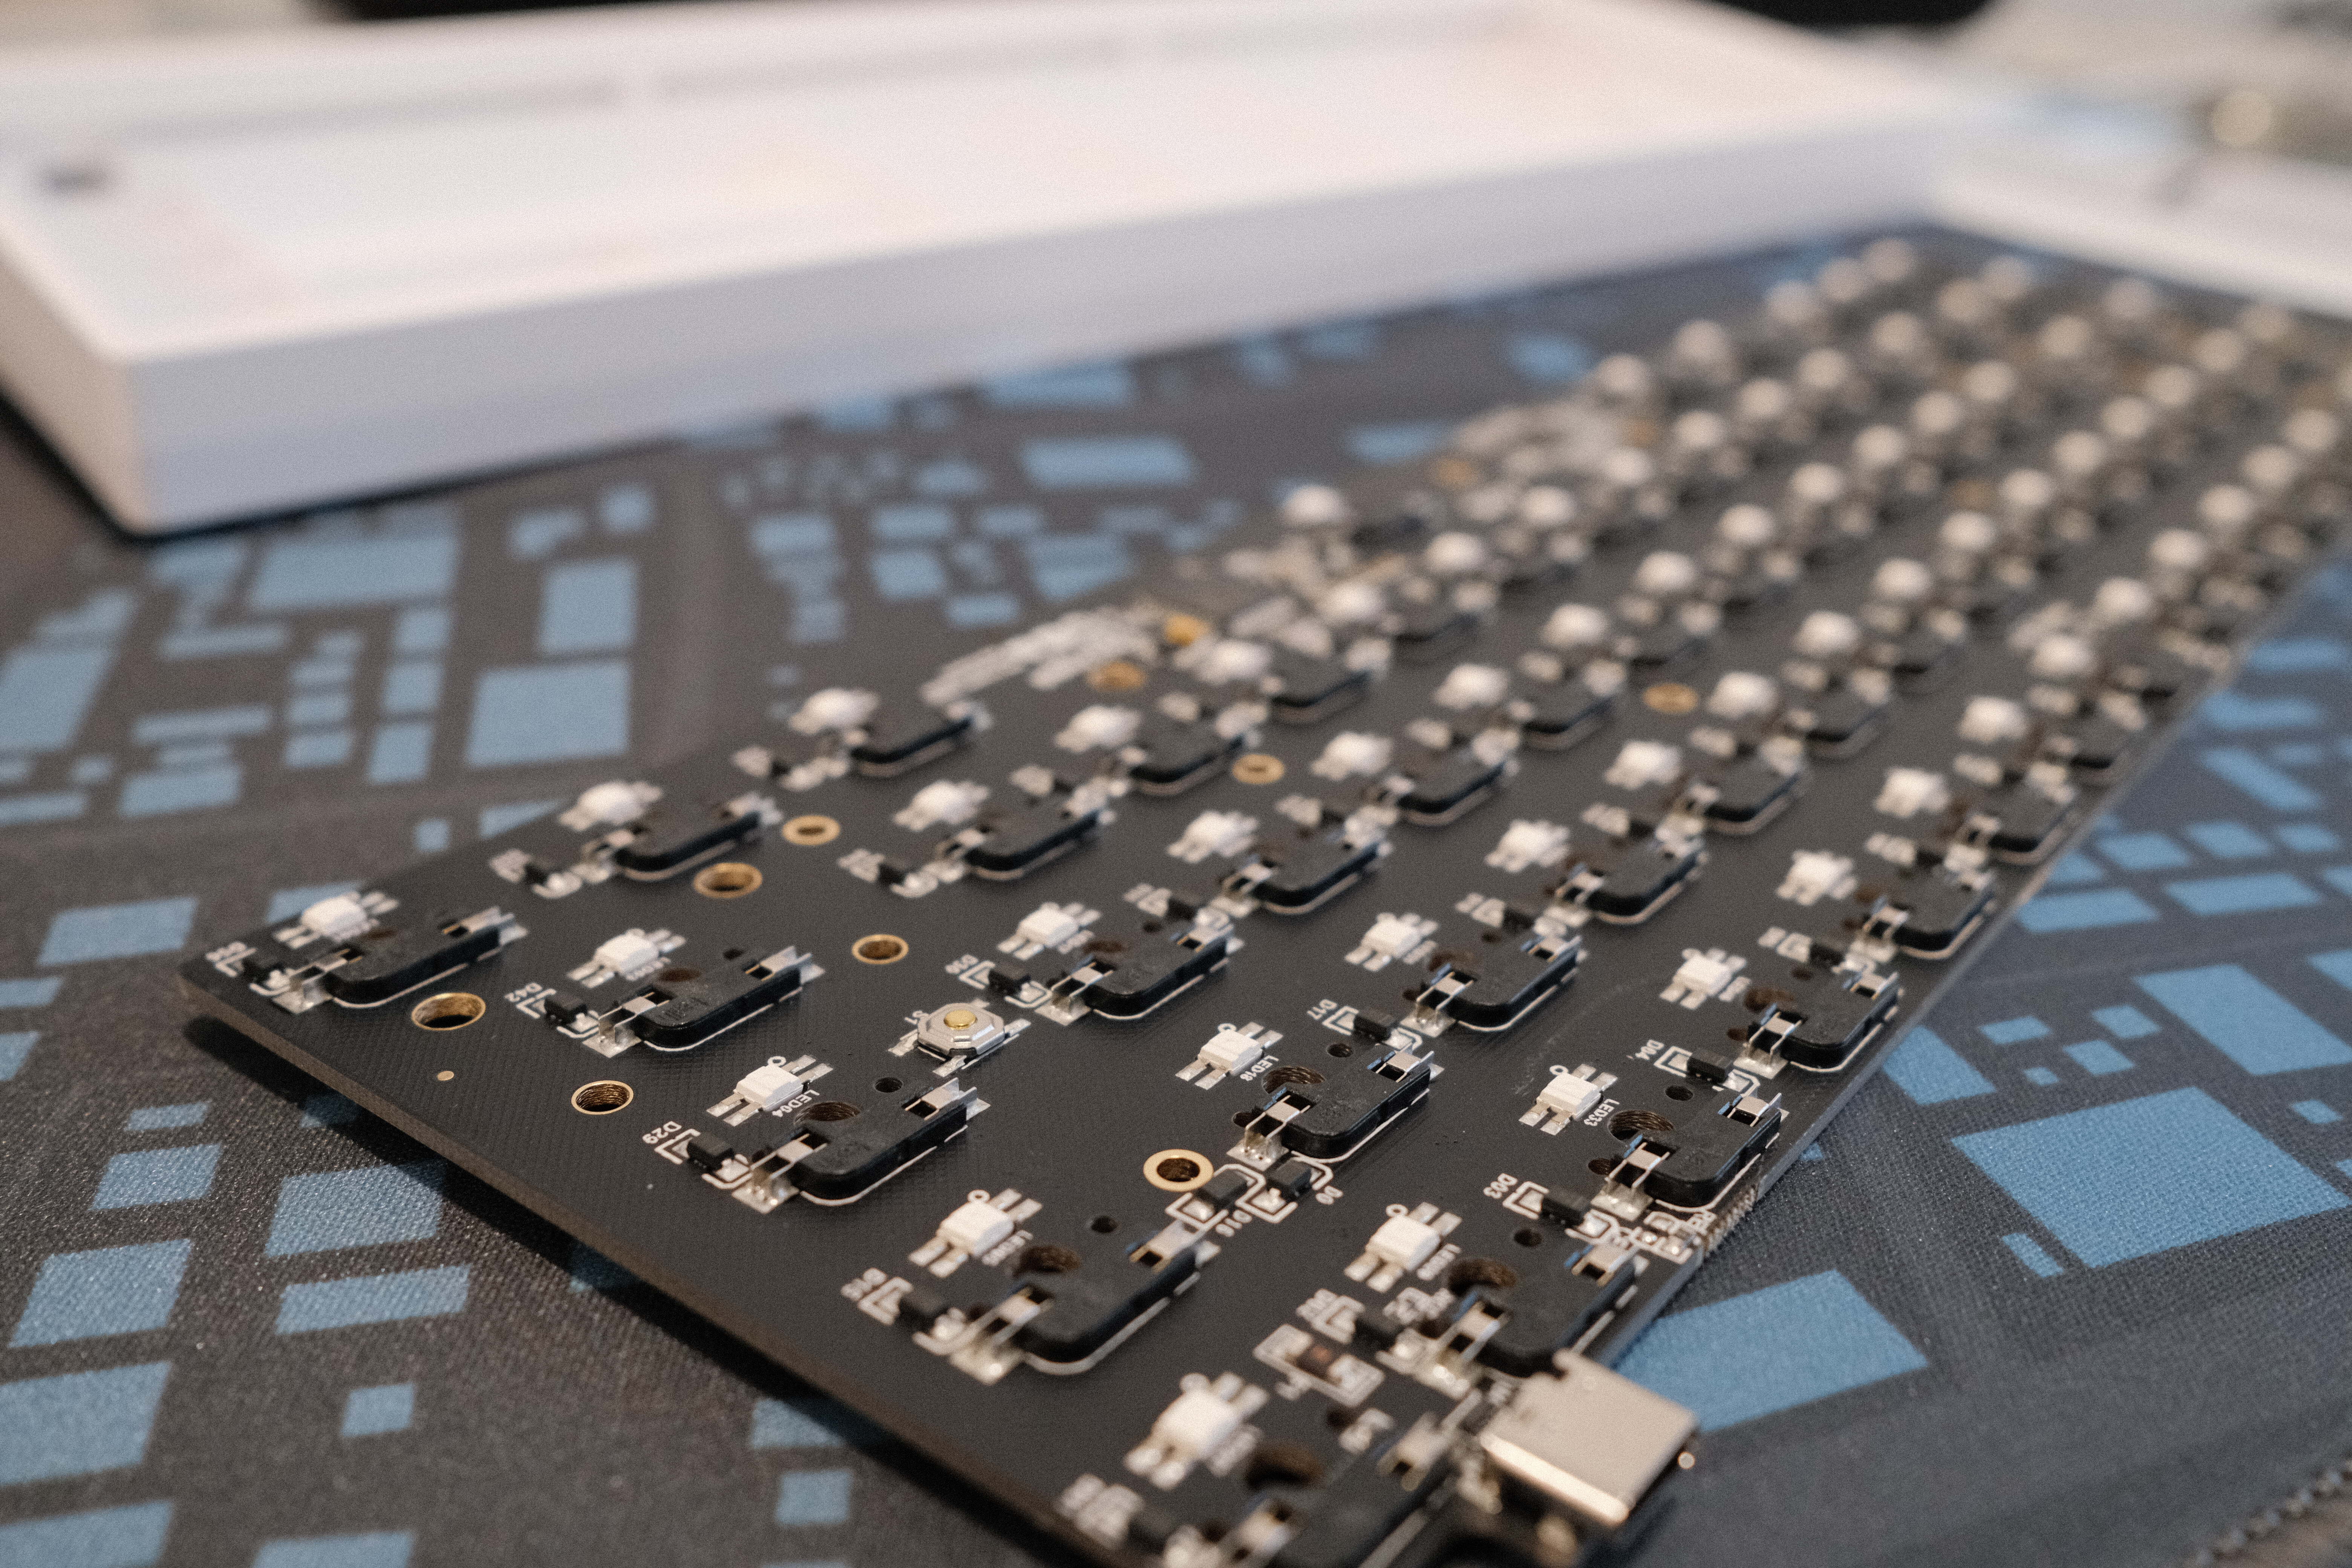
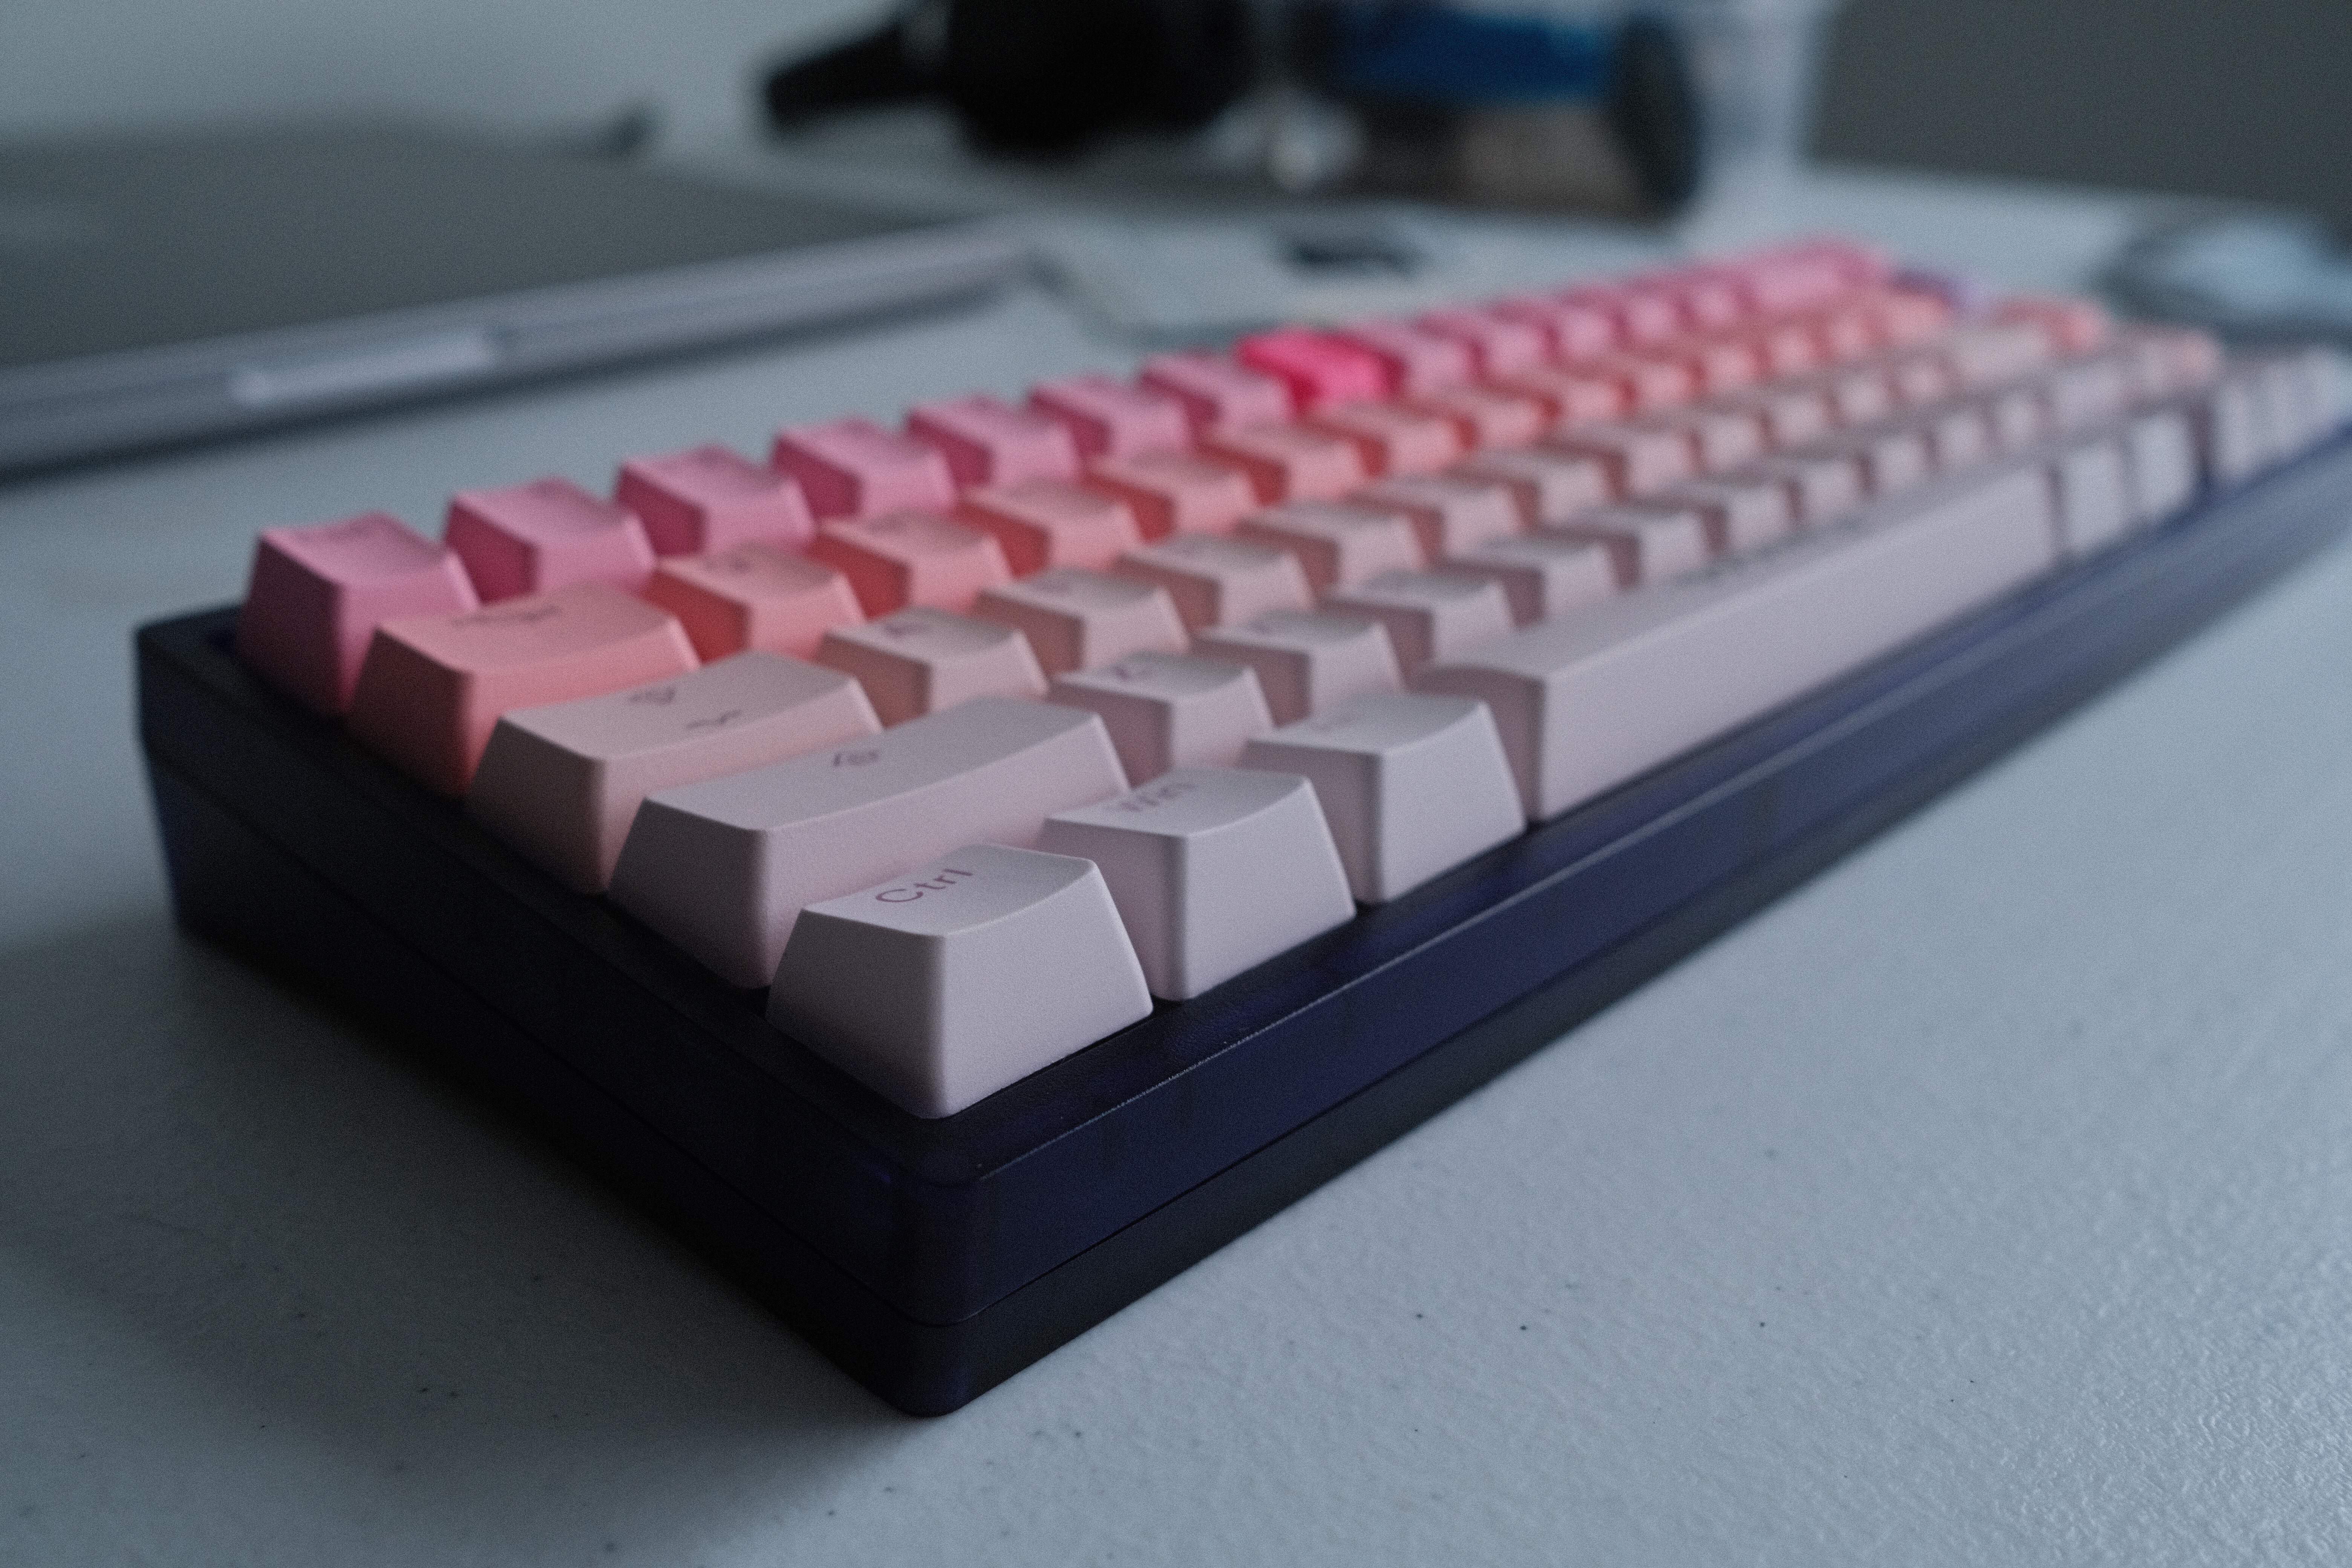
Kiddo picked out keycaps that make this lovely gradient, and they feel really nice.
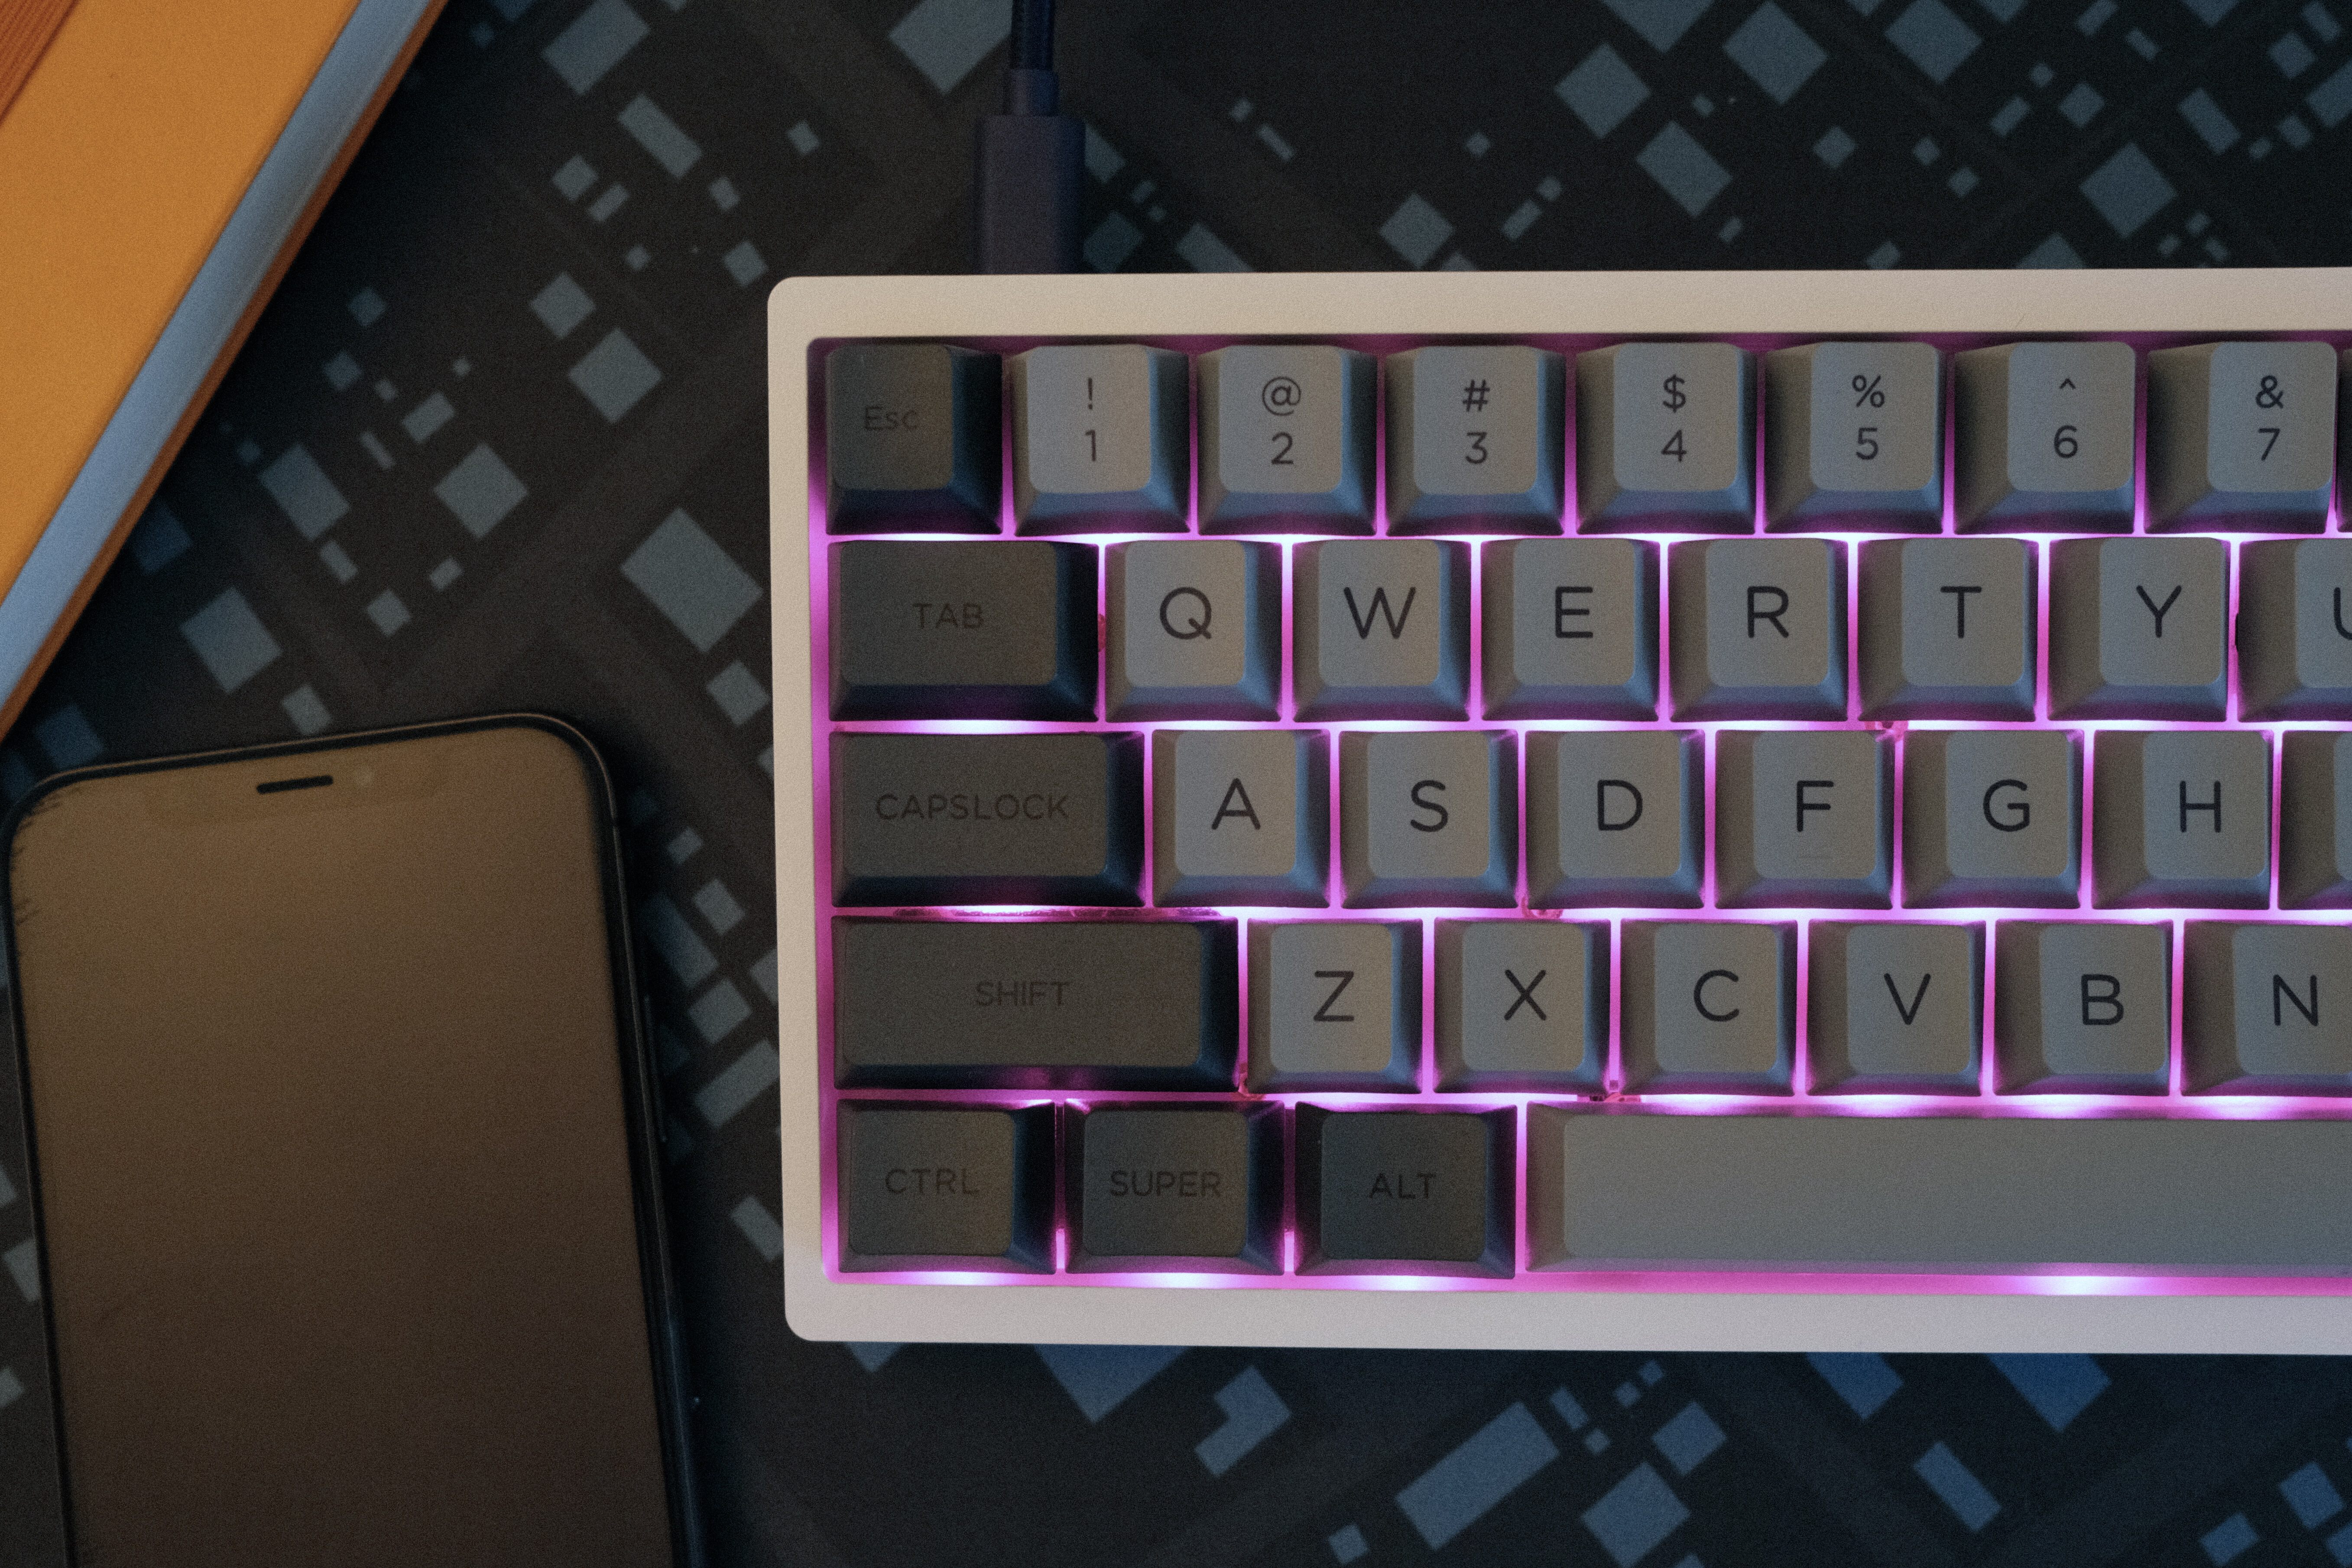
I went with gray keycaps on a white case. So far this board is a real pleasure to type on. Now that I have a good point of comparison with my Q1 board I can start to get a feel for how qualitatively different switches and keys can feel. By comparison, the Q1 is indeed a little pingy, for example, so I’m even more curious to see how some modifications to its components could feel.
After the build, I did some work in QMK to program a couple of MacOS specific layers for the KBD67Lite. Unlike the Q1, it doesn’t have a hardware mode switch, so I have to make a virtual one that lets me toggle Mac and Windows layers with a key combination. Fortunately I was familiar with working in QMK from all the screwing around I did with the vim mode I built, so it didn’t take too long to figure this out – and I’m happily typing away!
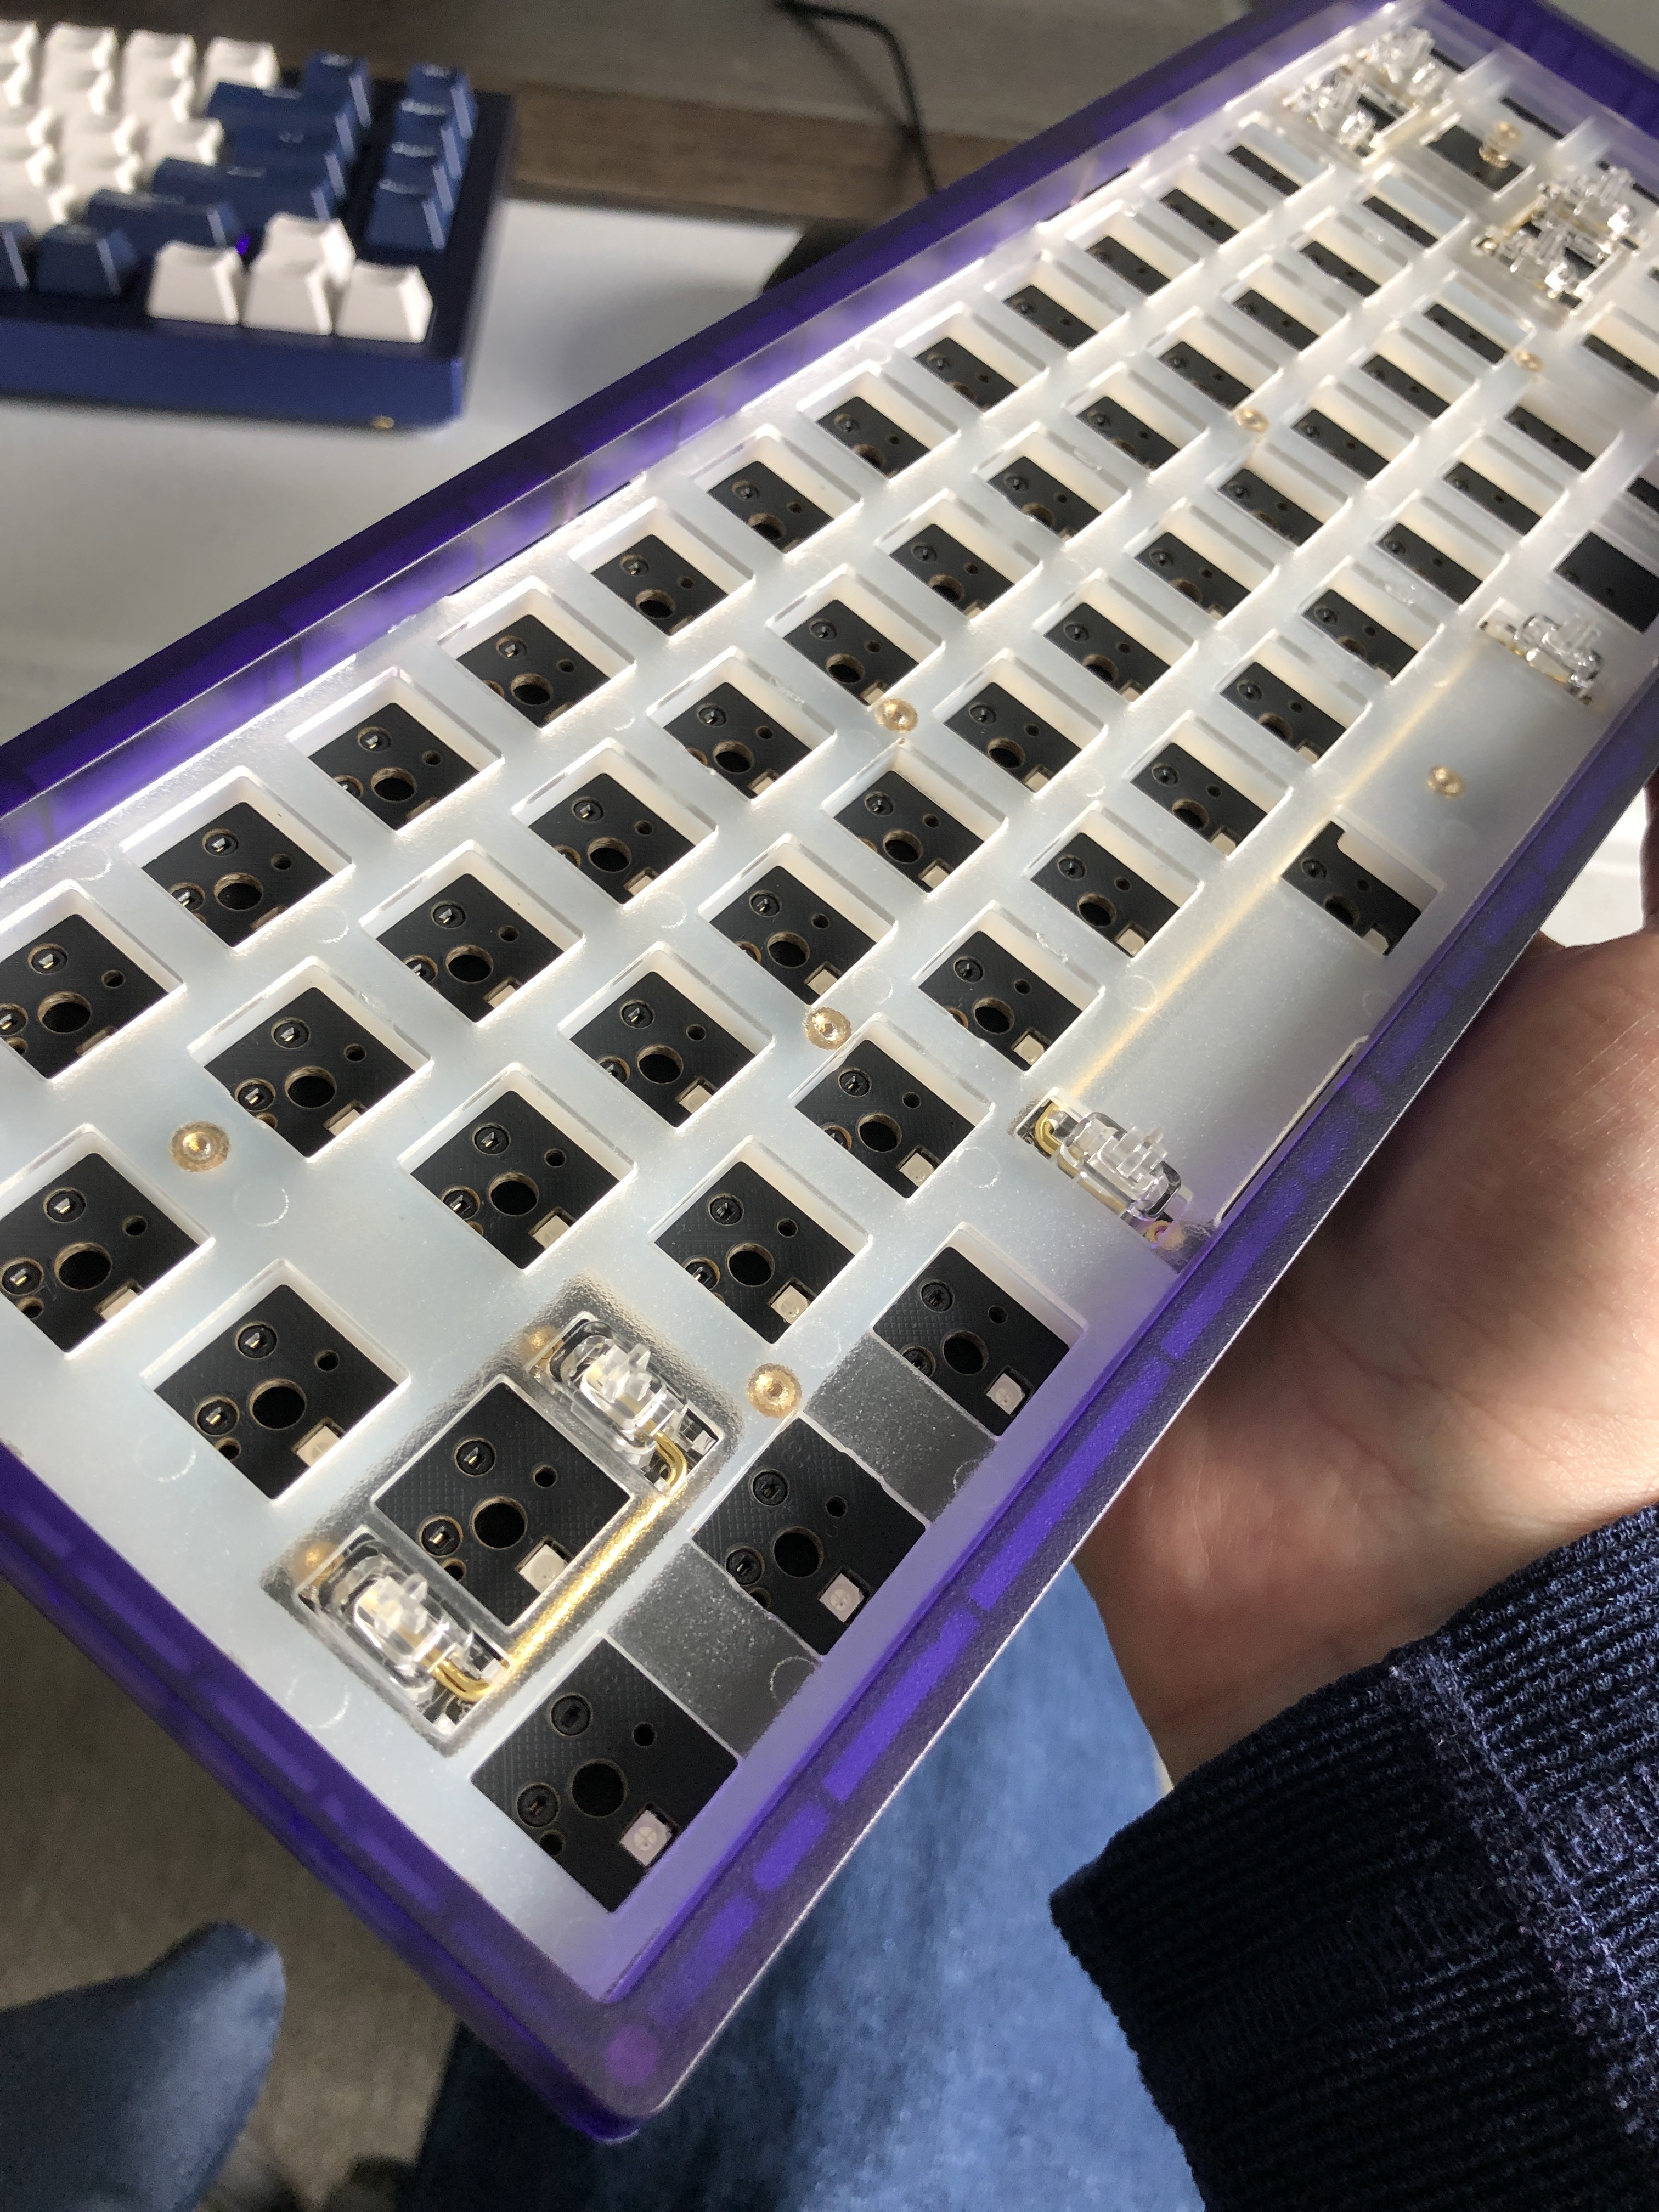
Building this kbd67lite with kiddo was a good Christmas day project. (I got one for myself, too – caps and switches should arrive tomorrow!)
Playing around with my last.fm stats Shiny app a bit more this morning, and I remembered how to get what I want out of a nested list returned from the API with only 20 minutes of cursing. Progress!
This thread of spreadsheet-based games contains a ton of inventive and fun stuff.
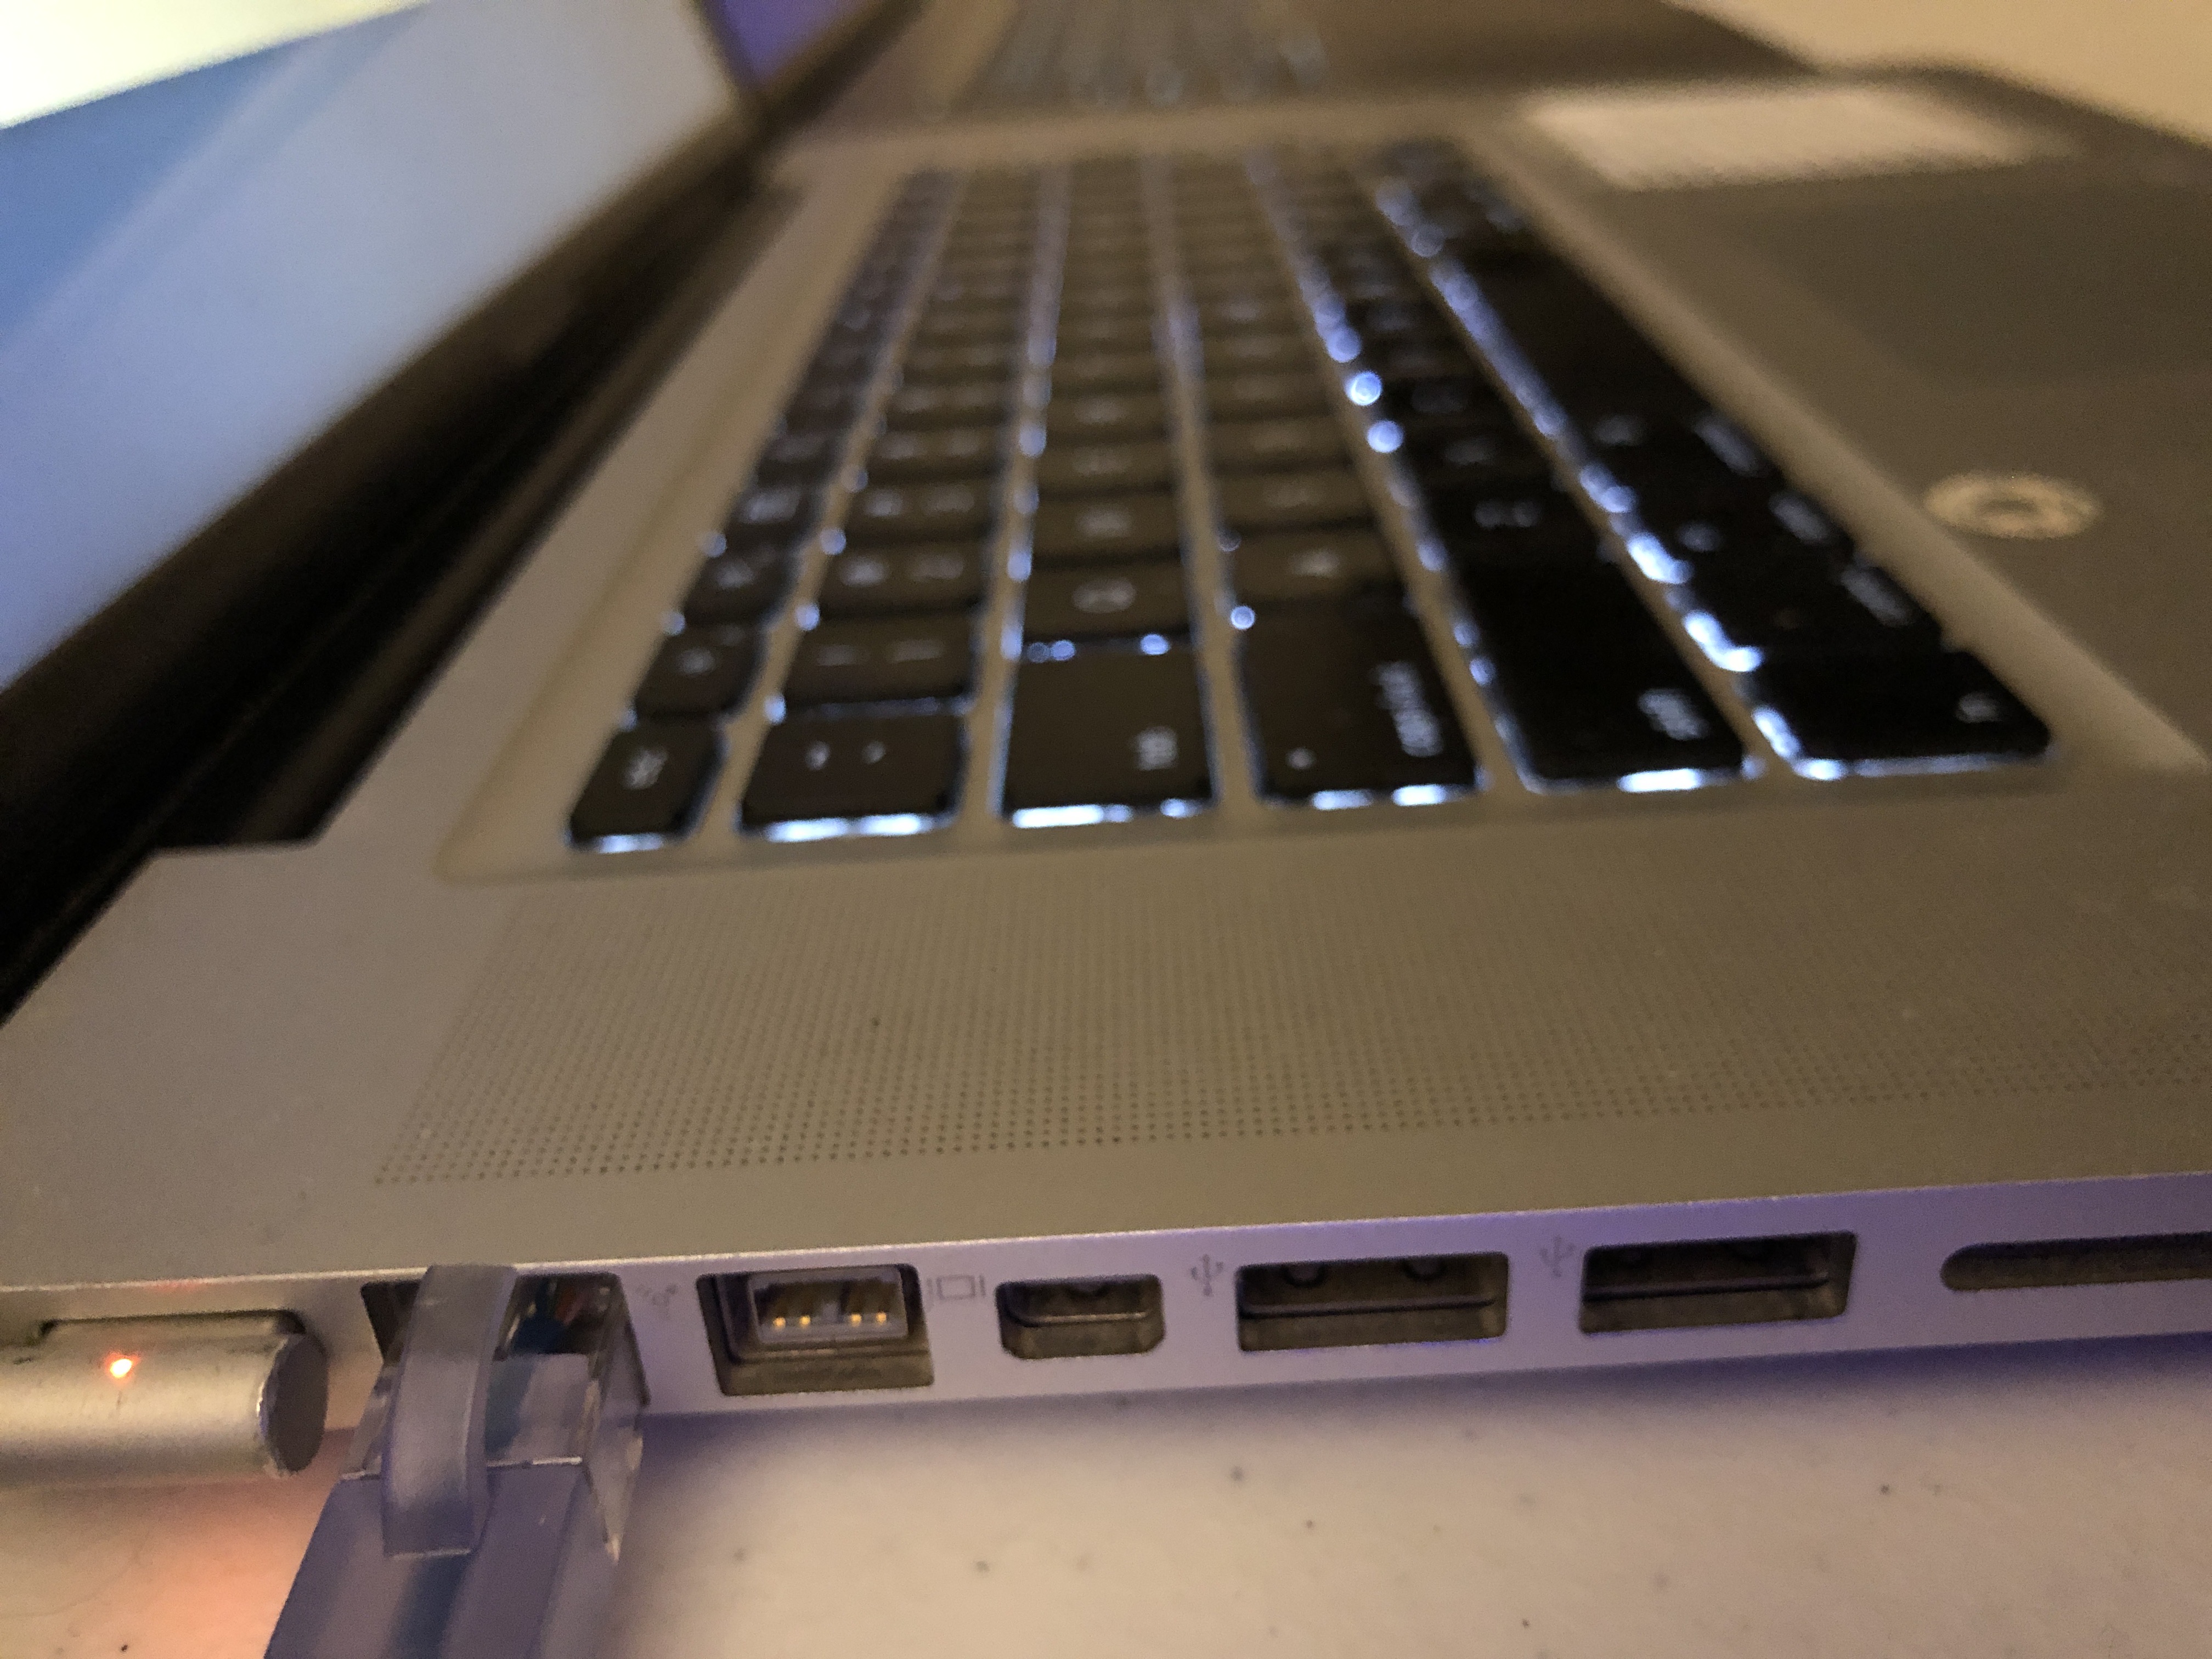
Holiday tech support operations resume this year with setting up Dad’s 2009 MacBook Pro to migrate to my year-old model. Look at the ports on that thing!
Made one more small adjustment this morning to tuneR, adding a date range selector to limit the query. It’s fun to see how my top artists change when adjusting that window.
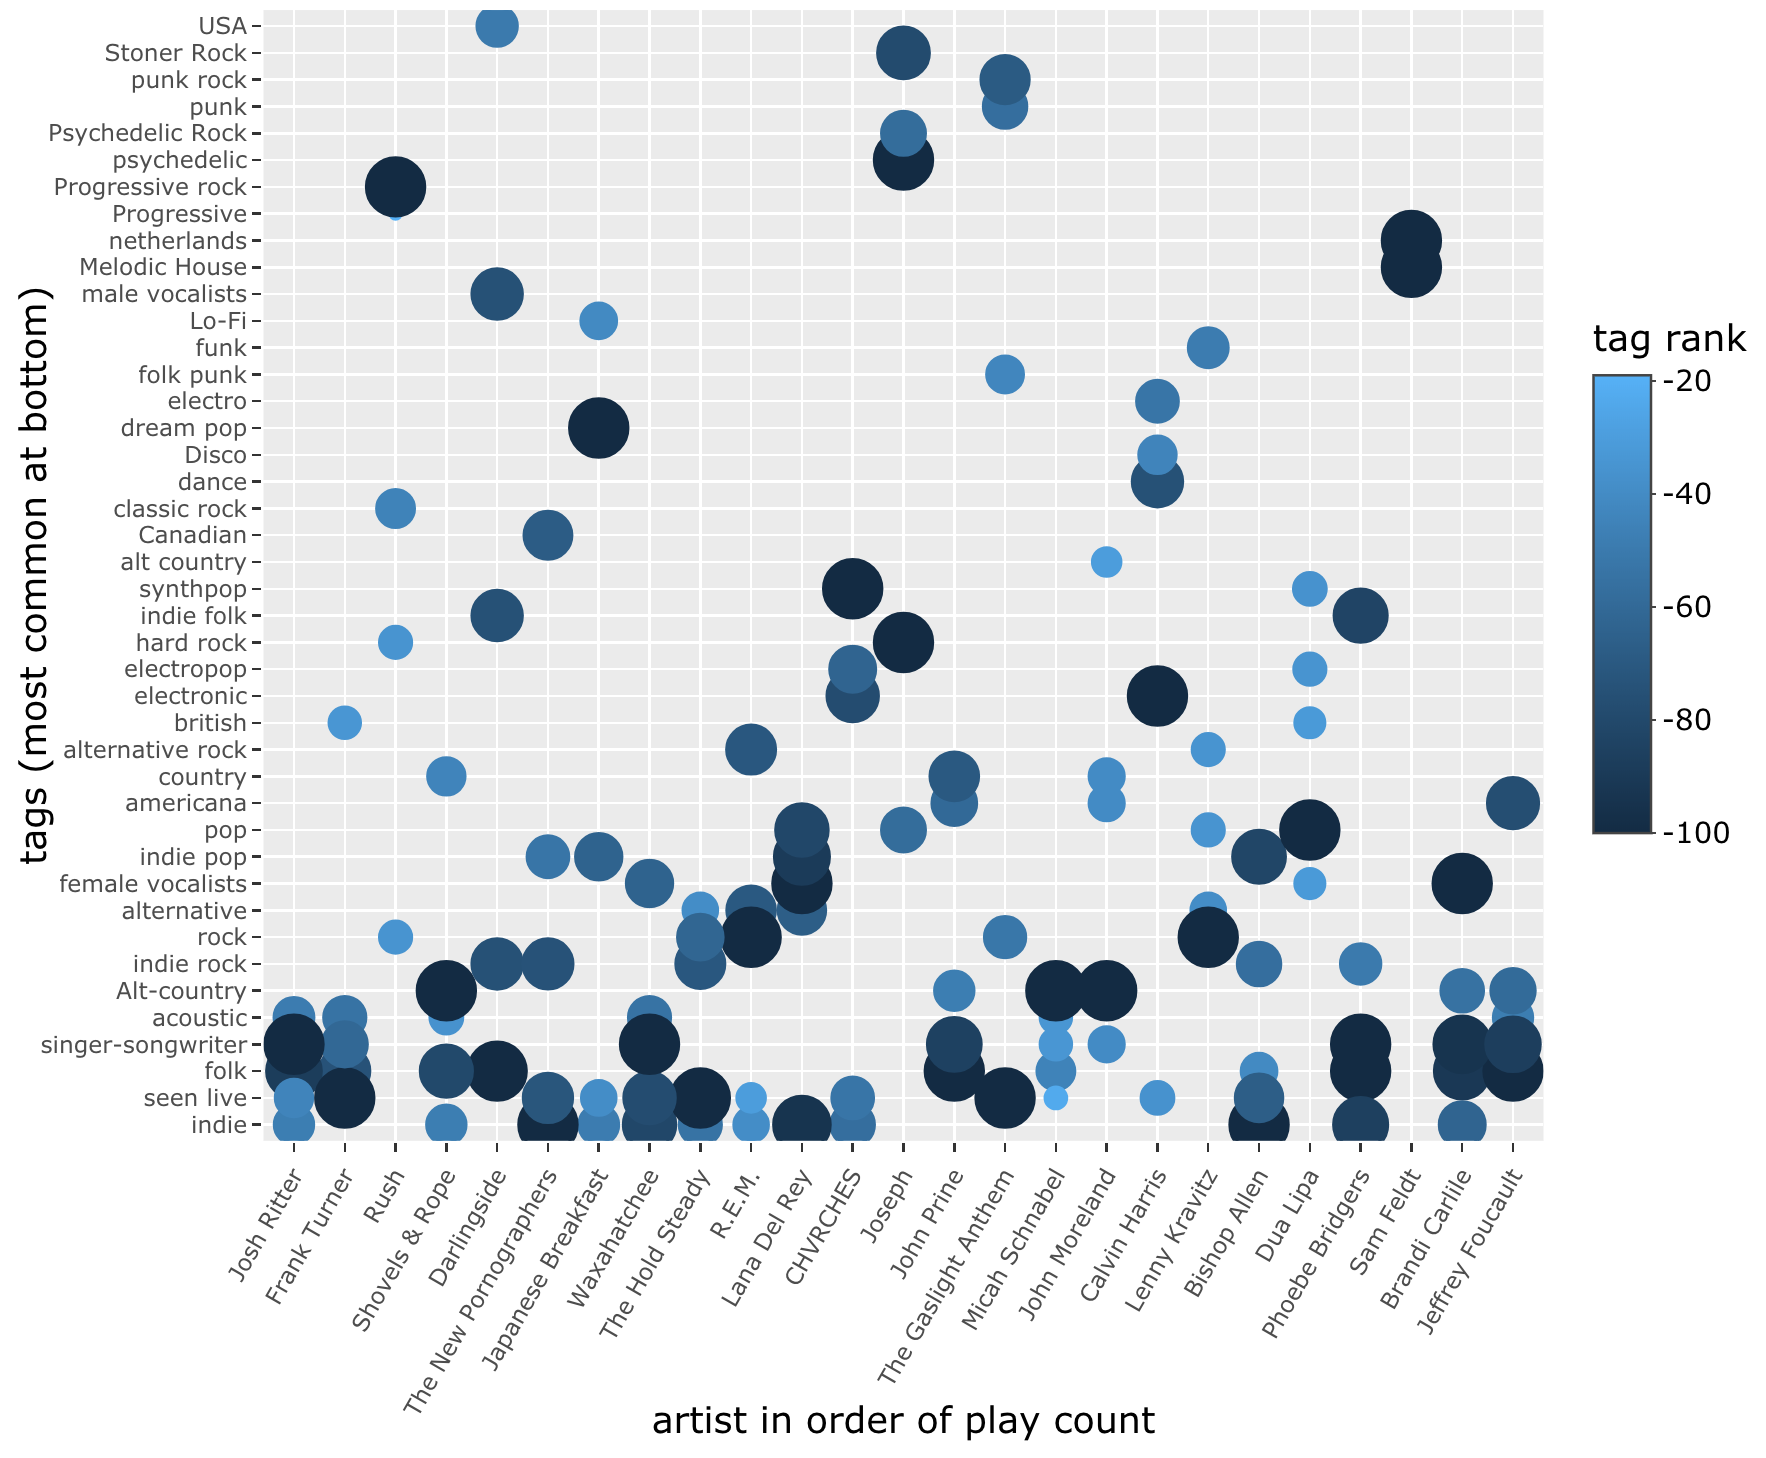
Okay, one final (probably) revision of tuneR for today, adding a bit of color and sizing to the plot of tags by artist, to show variation in tag rank within each artist.
What I’d give for a fish shell-style approach to command history in the R console.
A lot. I’d give a lot.
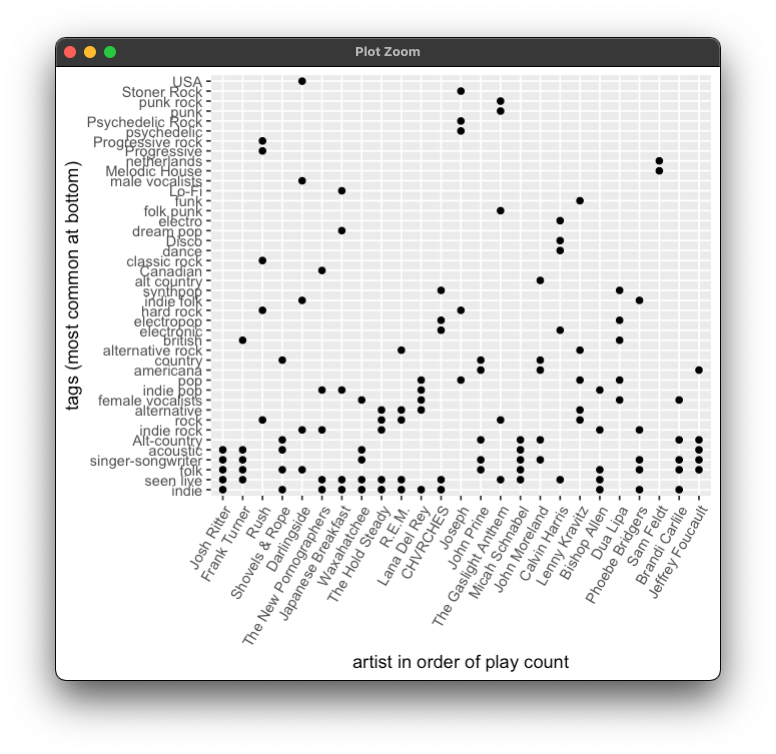
Today’s small revision of tuneR adds a scrollable table of user-assigned tags to your artists, and a plot of artists by tag sorted to show the most used tags across your top 25 artists this year. Coming soon – possibly some track-level data!
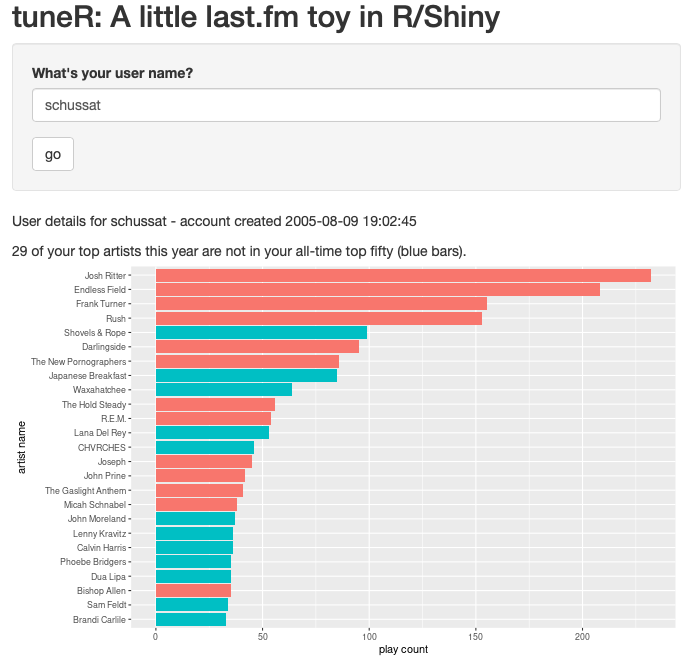
Inspired by all the enthusiasm for Spotify’s end-of-year Wrapped summaries, tuneR is my extremely rudimentary first start at my own version, done in R/Shiny. I’d love to hear if it works for you and what else would make it more fun!