
Pretty Good Hat

Tag: Workouts

Infographic card for a 30 minute Peloton Sweat Steady ride with instructor Jess King. There is a photo of her standing in a pink top and leggings with her hand on her right hip. The graphic shows my heart rate through the ride; I’m in the red for about half of it.

Phase one after a really hard spin:

Lo, I am a being of pure heat, deeply calm and still after furious expression of will and strength.

Phase two: why does my house have all these staaaairrrs and why don’t we have any baaaggeells
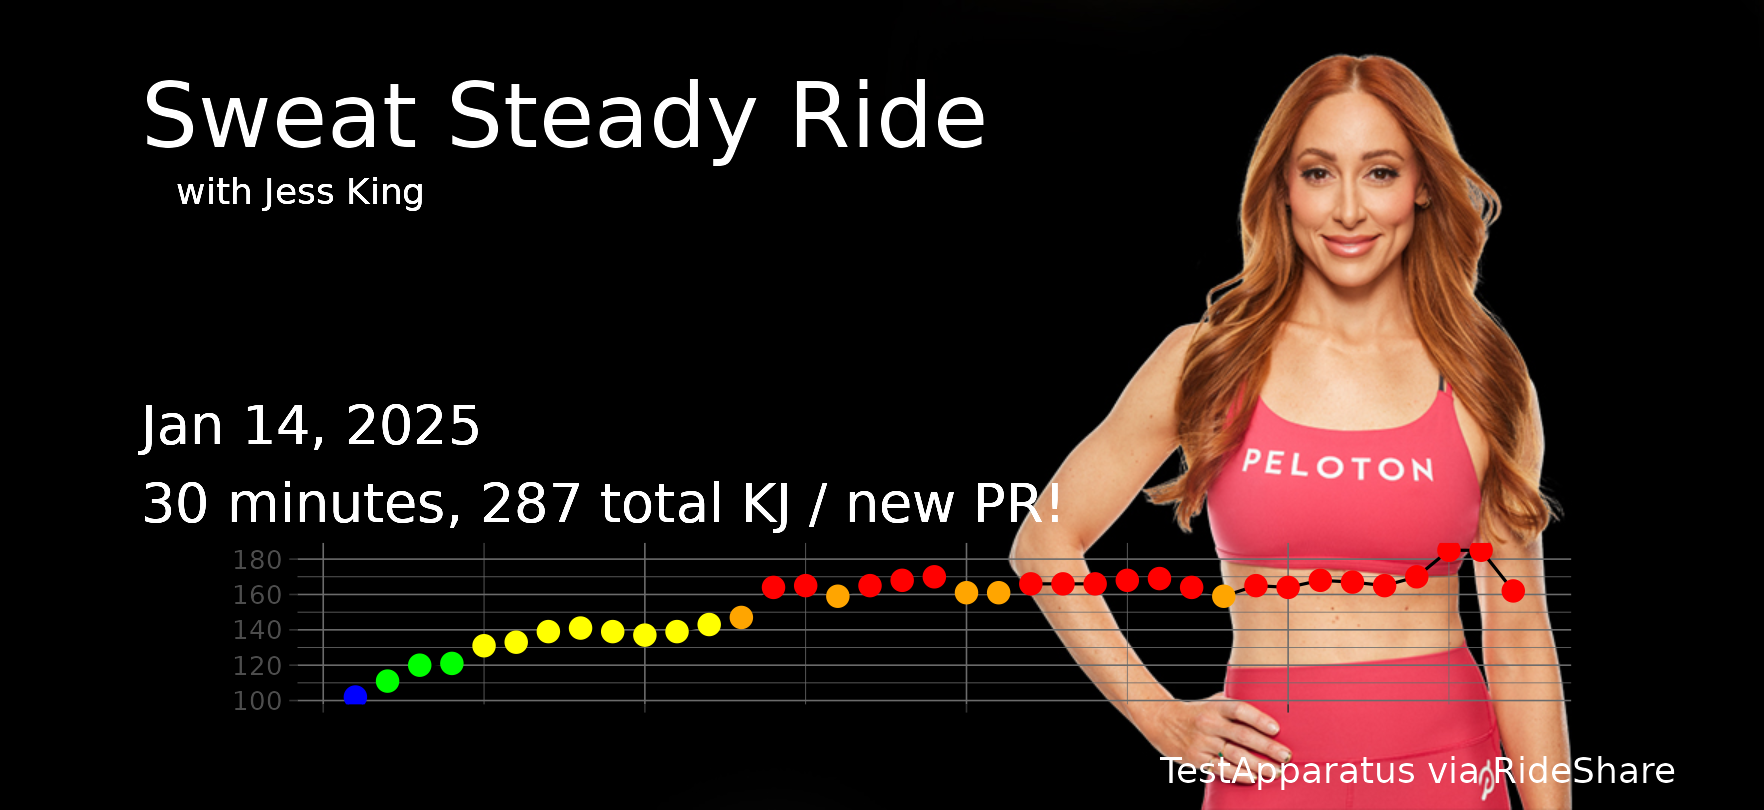
I’m starting on some of my end of year data projects. First up, a bit of output from the summary visuals I’m building of my workout data! I know, I know, polar plots are bad data representations, but I really like the clock-like image for this depiction of workout times.

A radial bar plot, in a half circle design. It shows the number of times I worked out at different times of day throughout the year. I am heavily a morning workout person, with many 4am and 5am sessions.