
After briefly operating again, authentication to the Peloton API has been re-restricted. There are apparently some workarounds, but building a bunch of OAuth mechanics on top of a non-public API is a lot of work on something too fragile for me to rely on. That means that RideShare is inoperable for the foreseeable future, and that’s a big bummer!
Much, but not all of the ride data continues to be available through Apple Health, so I can continue to use a lot of what I did to summarize the year’s exercise data last year. Here’s a quick comparison of workout intensity in 2025 and 2024.
My little data vis all for my Peloton rides broke a couple of weeks ago, but clever developers found a way to continue using the API, so it’s back, for now. I wish Peloton would publish an official auth flow; they would see an explosion of support and interest from small and big developers, I think.

My week in riding the bike: I was under the weather after a few long, in-person work days last week. Improving early this week, I started up slow but built to feeling really good for this morning’s dawnbreaker HIIT and Hills thumper.


Phase one after a really hard spin:
Lo, I am a being of pure heat, deeply calm and still after furious expression of will and strength.
Phase two: why does my house have all these staaaairrrs and why don’t we have any baaaggeells
Over at the datablog, I wrote up some details on producing my 2024 workout summary from Peloton and Apple Health data. This was a fun little project to tinker through over my holiday break.

Last Peloton ride of 2024 went quite a bit harder than I was expecting. I’ll go out sweating hard because I can, and I’ll try to start 2025 the same way.

I hit this Turkey Burn ride pretty hard this morning and am resting deep in post-ride endorphins, now. Time to sip on my coffee and think on some thanks. I’m glad I get to do this.

Got in a solid ride first thing this morning, plus some cool-down time and stretches. I’m sitting now with the endorphins and calm that come in after a hard workout, appreciating the quiet and still after furiously working in my body.


Got on the bike for impromptu ride #200 this morning! This was my first live ride in quite a while, and was a lot of fun – and a good amount of work, too.
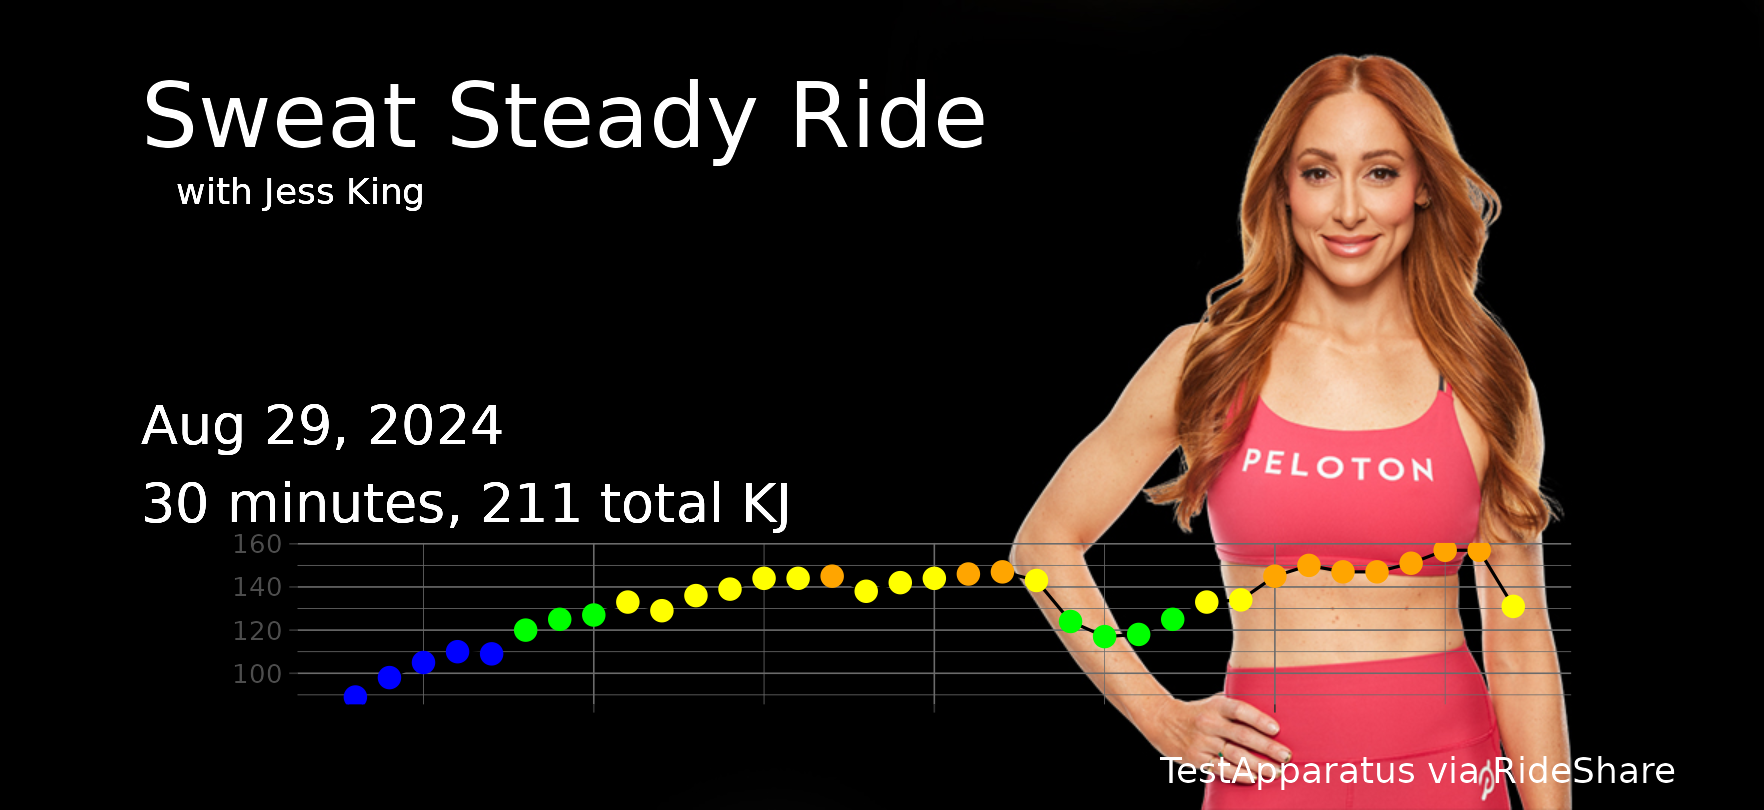
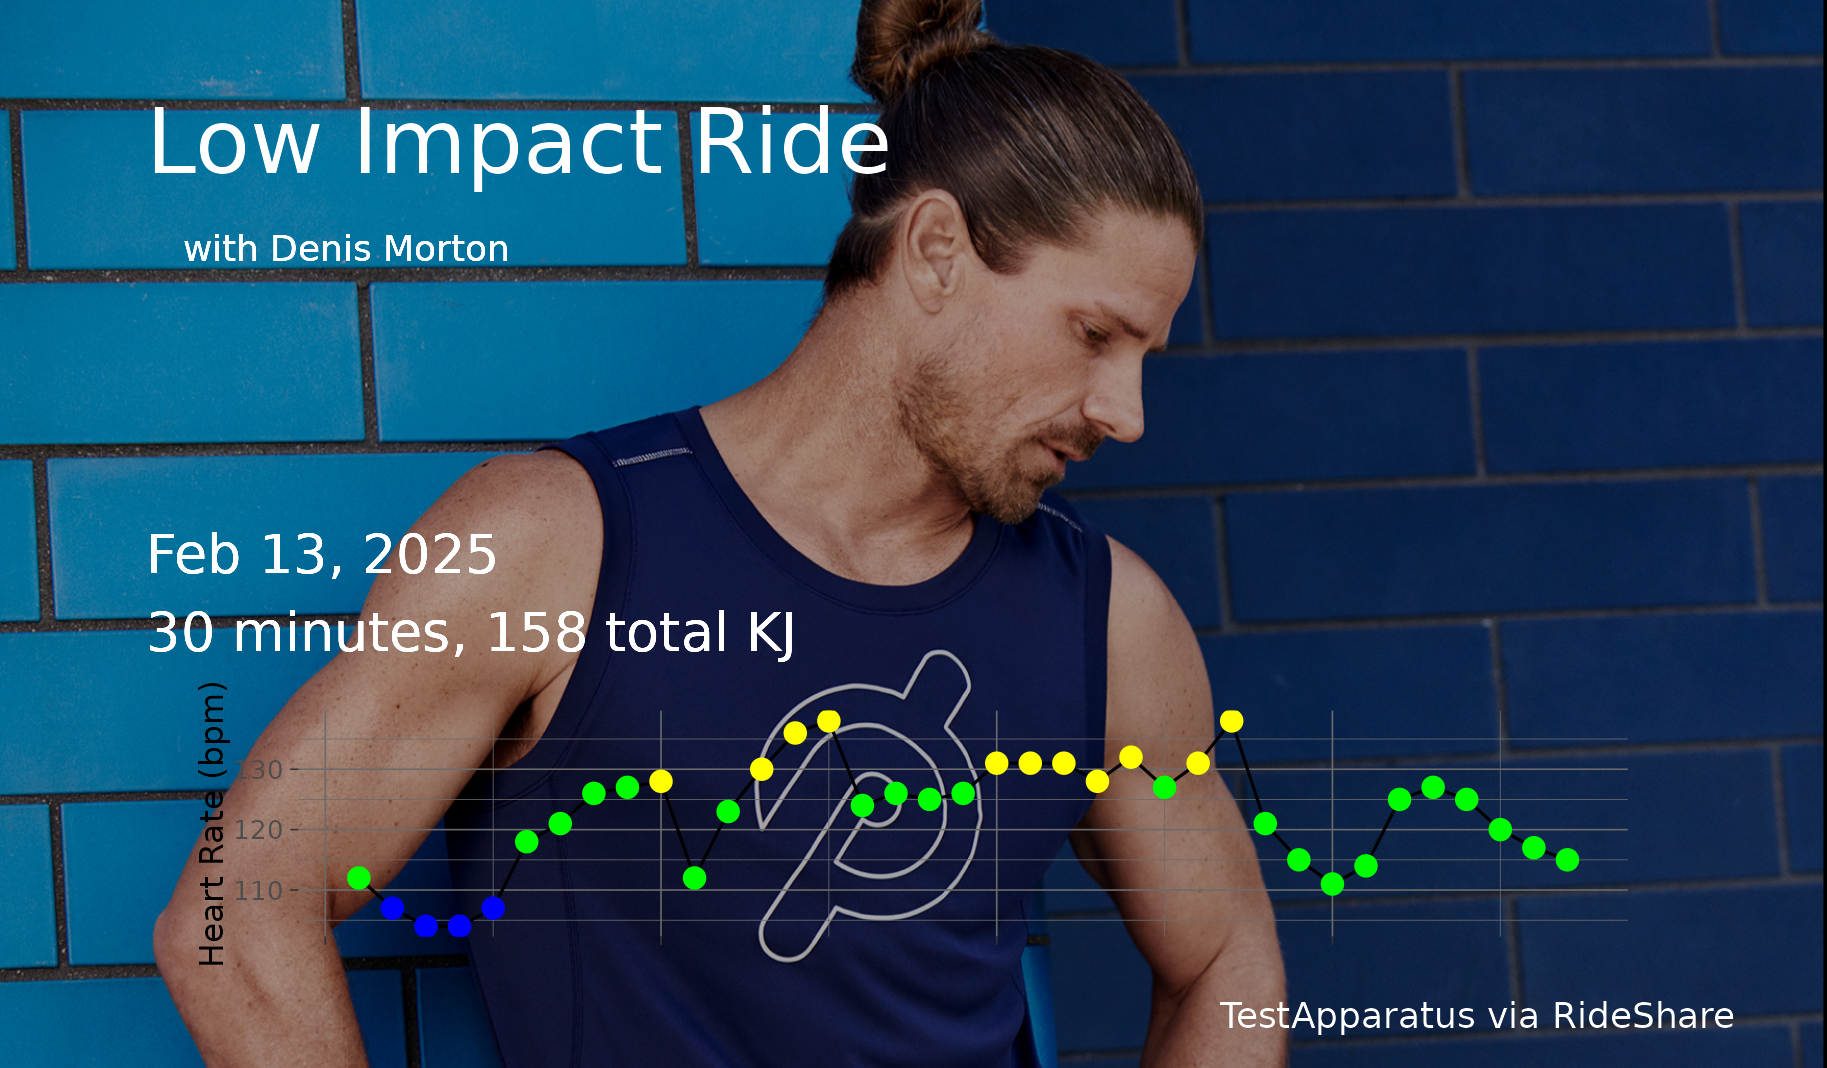
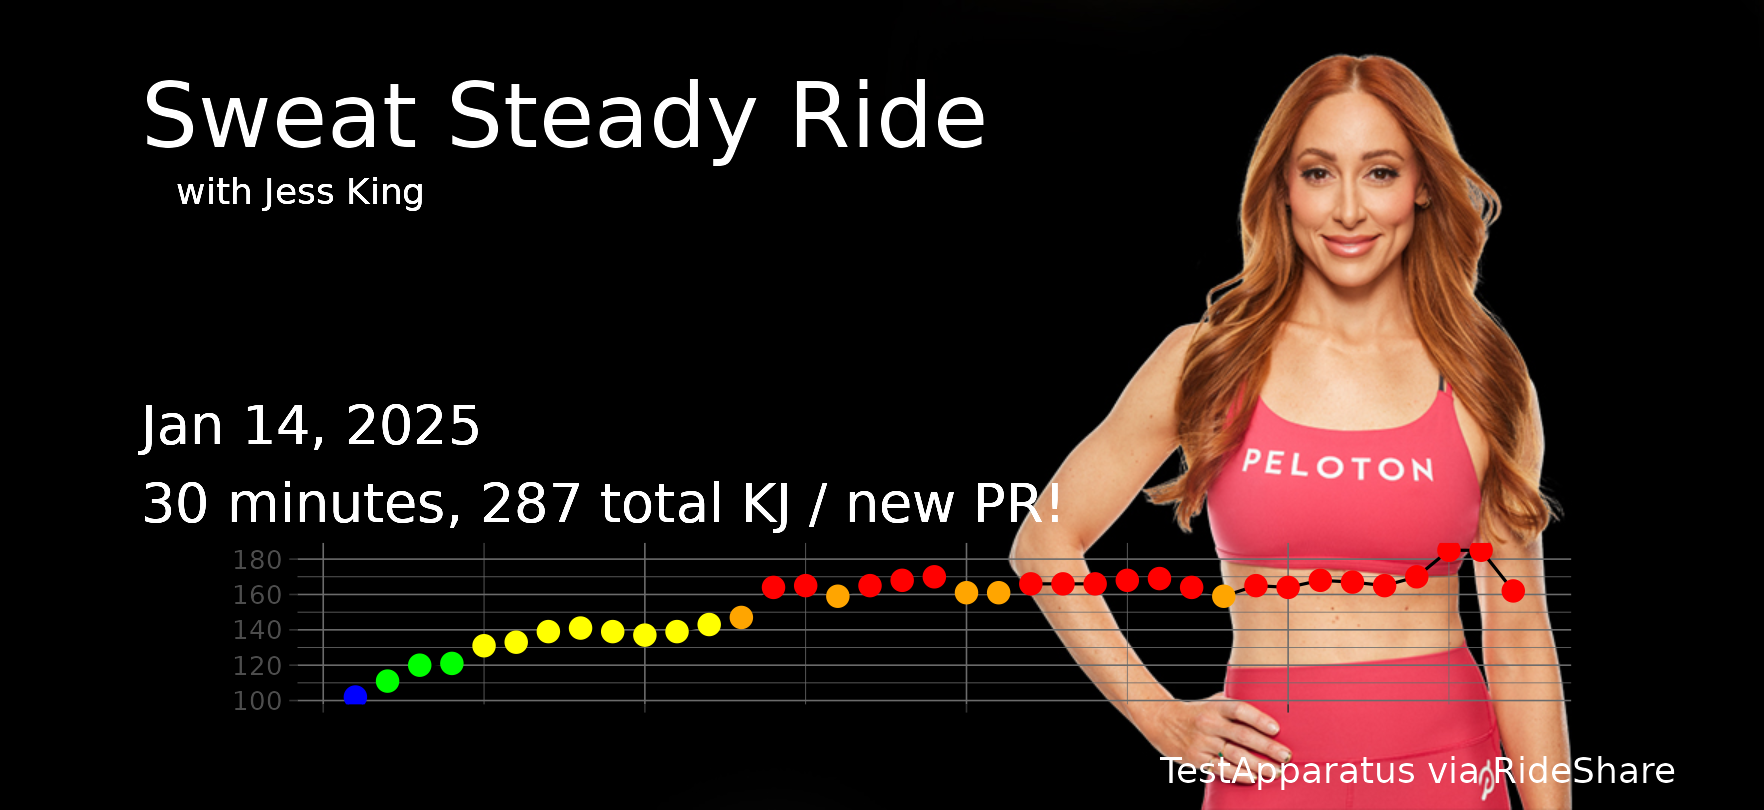
I’ve been making some small visualization and operation improvements to RideShare, my little Shiny app for making shareable cards from my Peloton rides. I discovered the API for more detailed heart rate data and incorporated that into the display, and made a couple of changes to speed up the history display. These were fun small updates to work on!