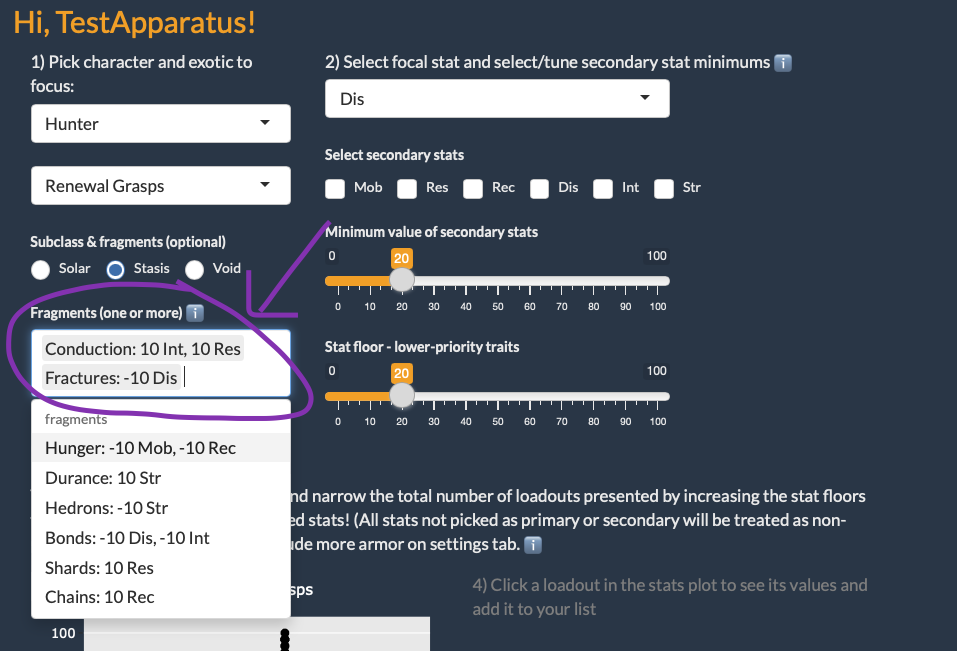
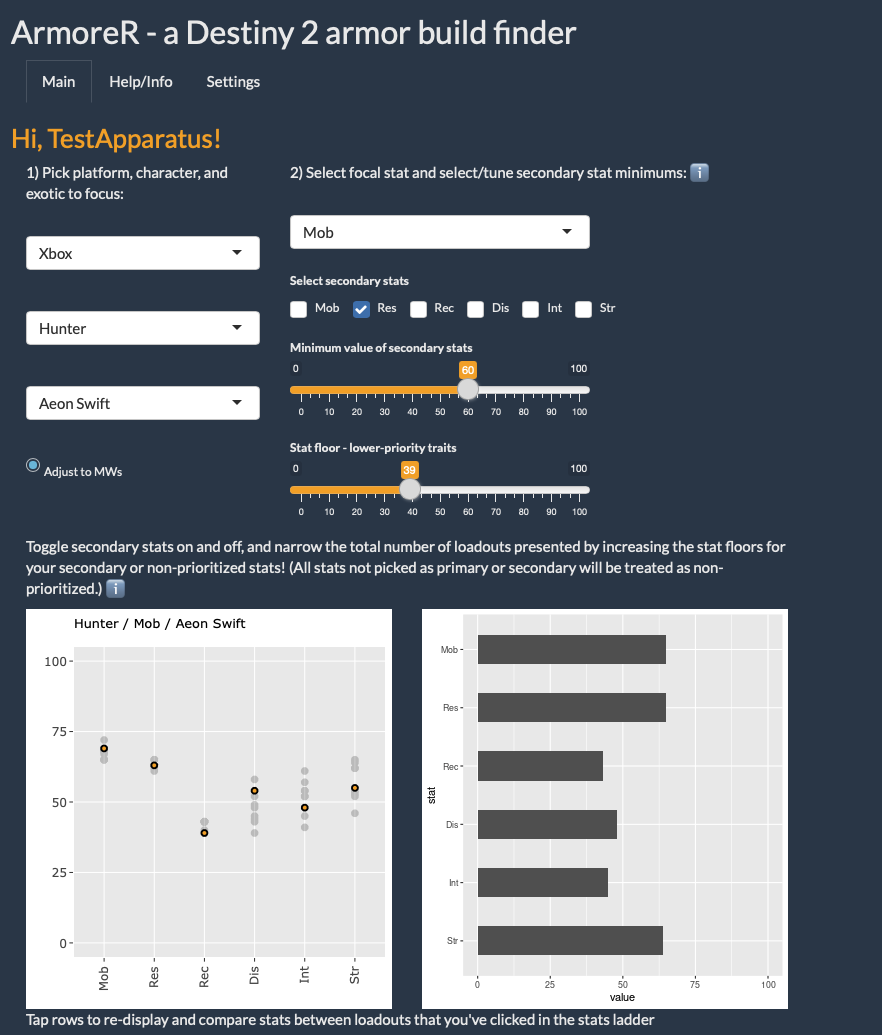
I finished a big update to Armorer this week, to enable inclusion of subclass fragments in stat calculations. I learned a ton with this release and laid good groundwork for additional mod management. I’m pretty pleased!
Super-pleased to see that a couple of small Shiny app improvements I made this weekend correctly picked up on some source data changes today and automatically handled them. Pretty cool!
I successfully made some small changes in a Shiny app to use the {pins} package to separate out a support file and data definitions from the app bundle itself. This lets me revise supporting information without needing to republish the app. It’s pretty cool! I’m excited to use the package lots more.
Sharing a quick tip that I’ve found useful while building with Shiny, recently: It’s handy to be able to save off the current state of a data set for bringing over to a scratch file. I made the download link appear only when running in my local environment. This way I can easily snapshot my in process data set for experimenting with visualization in my scratch file.
In ui.R:
    if(interactive()) {
      downloadLink("downloadData", "💾️ Download data set")
    }
And in server.R:
    output$downloadData <- downloadHandler(
      filename = function() {
        paste("shiny-export_", Sys.Date(), ".csv", sep="")
      },
      content = function(file) {
        write.csv(globaldata$armor, file)
      }
    )
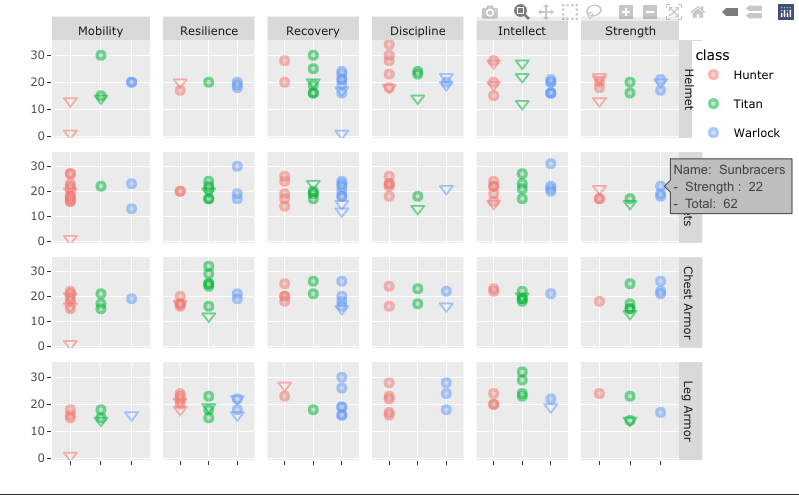
I had a good time this weekend coming up with a new way to visualize armor stat distribution in my Destiny 2 profiler tool. 🎮
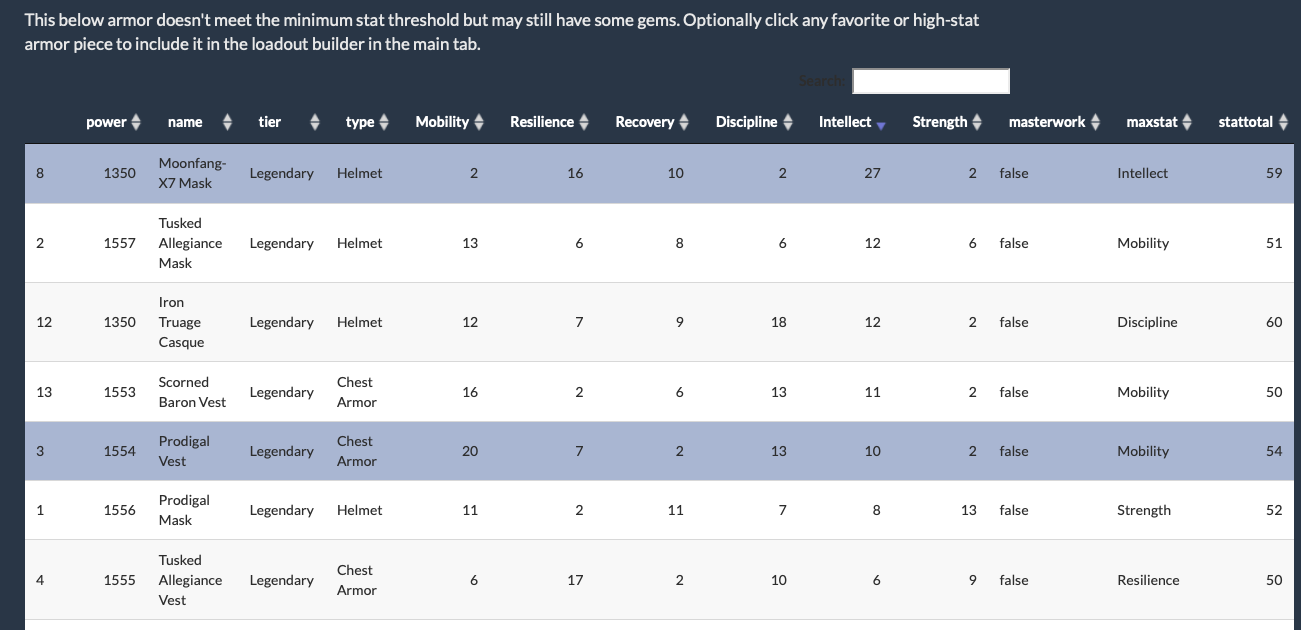
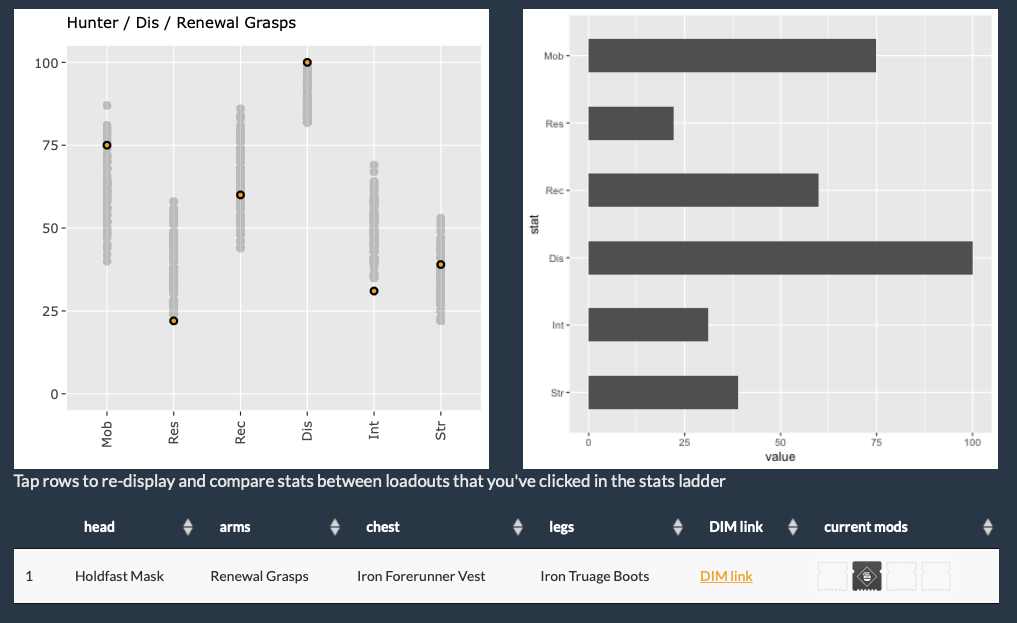
I’ve had a nice afternoon working on my hobby R/Shiny project, a loadout finder for the game Destiny 2. These improvements make it a lot more flexible and informative: It can now optionally include armor that would otherwise be filtered out of configurations by the minimum stat threshold, and it will show current mods used in displayed loadouts.
This revision of ArmoreR is really turning into something I’m happy with and proud of. I’ve learned so much since the very first iteration of this about a year ago. It’s really fun and rewarding to come back to it with a bunch of new expertise and make it much better in all ways, including a new approach to dealing with such a large amount of information.
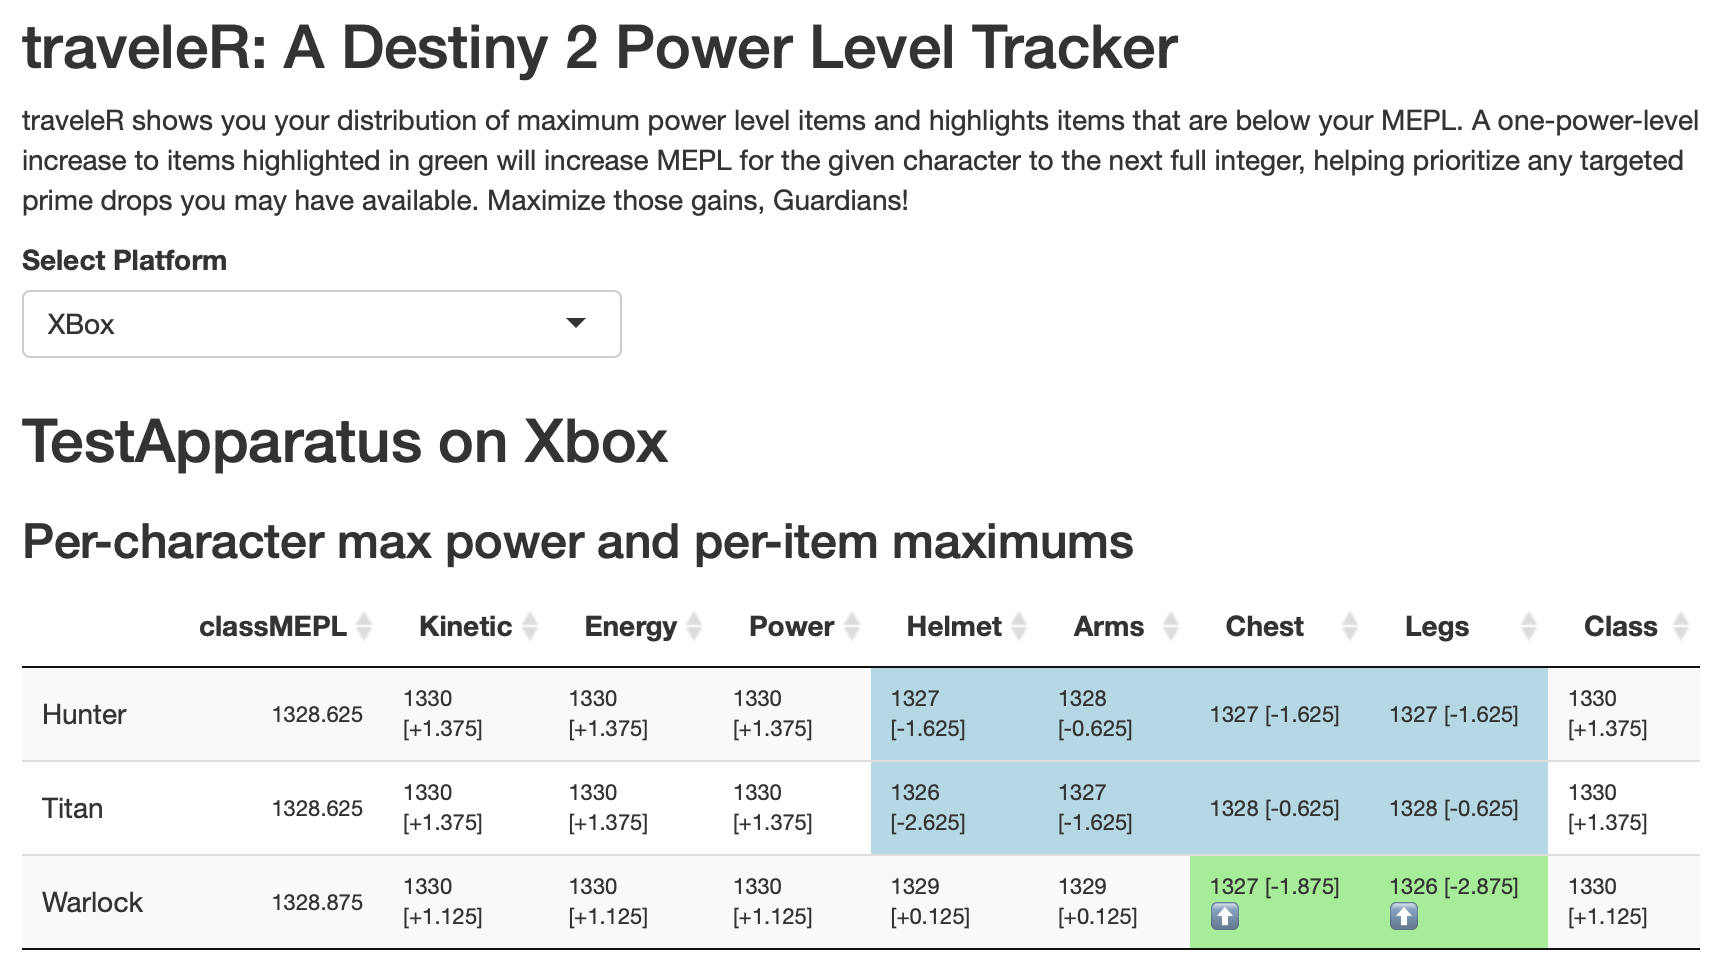
Last fall I wrote a bit about a Destiny 2 power level tracking tool I built using R. I’ve now converted it to a full-on Shiny app and solved some issues with the oauth2 flow that stumped me in my intermittent tinkering with it. I’m super satisfied to have been able to get this to work! Now that I have the authentication process figured out, I’m eager to also convert my armor profiling tool to use it. Look out!
You can check it out here: traveleR
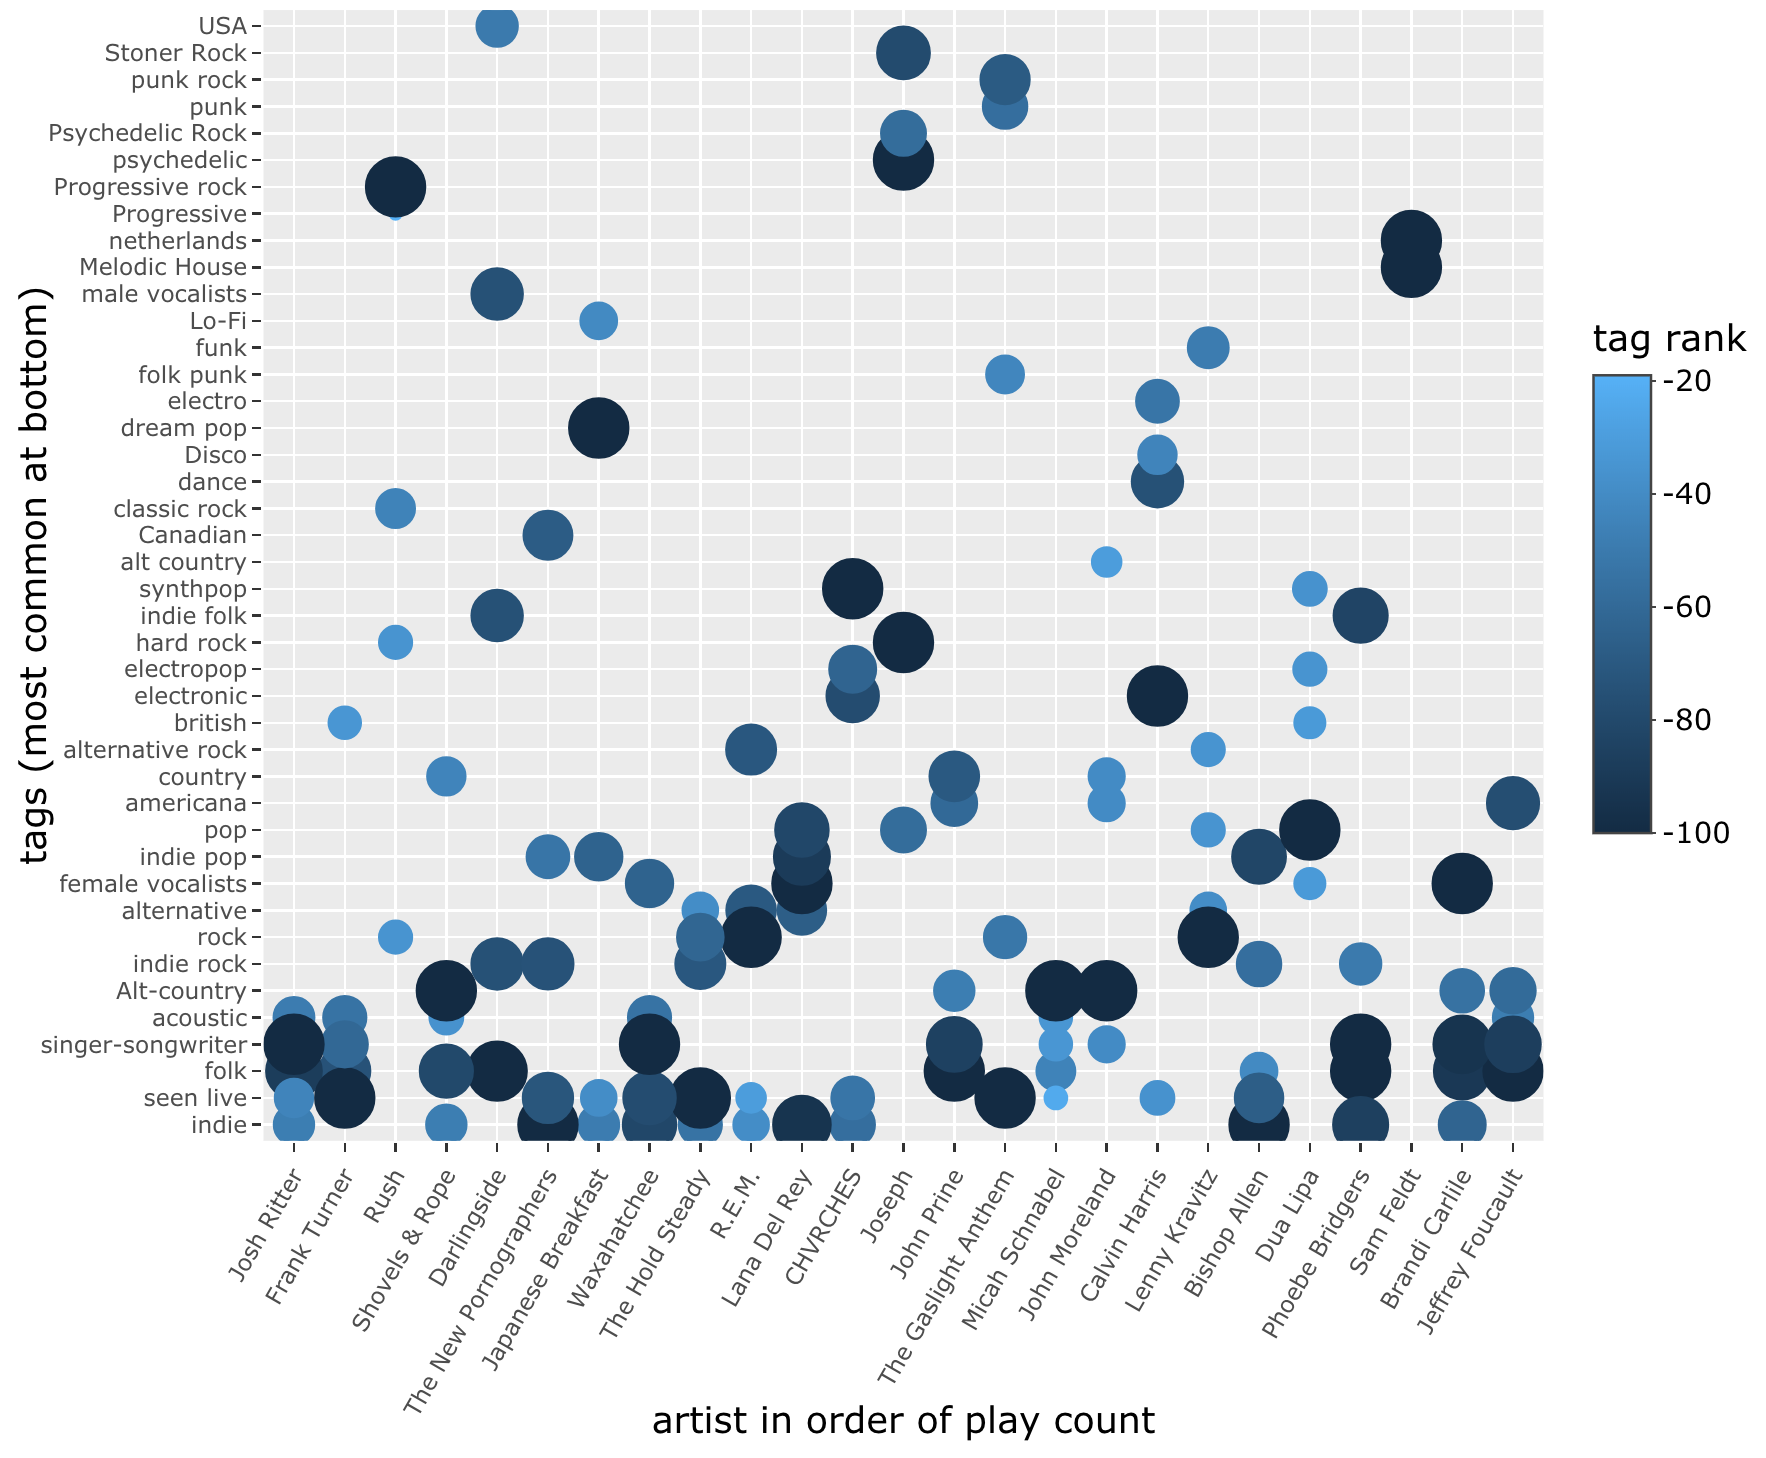
Okay, one final (probably) revision of tuneR for today, adding a bit of color and sizing to the plot of tags by artist, to show variation in tag rank within each artist.
